Is the Options Market Signaling an Increase in TROW Stock?
Options Market Activity: Investors should monitor T. Rowe Price Group, Inc. (TROW) due to high implied volatility in the Sept. 19, 2025 $140 Put option, indicating expectations of significant stock movement.
Earnings Estimates: The company holds a Zacks Rank #2 (Buy) and has seen an increase in earnings estimates from analysts, raising the consensus estimate for the current quarter from $2.26 to $2.40 per share.
Trading Strategies: High implied volatility may signal potential trading opportunities, with seasoned options traders often looking to sell premium on such options to benefit from price stability at expiration.
Investment Recommendations: Zacks Investment Research suggests exploring lesser-known AI firms for potentially higher profits, alongside offering insights into profitable trading strategies.
Trade with 70% Backtested Accuracy
Analyst Views on TROW
About TROW
About the author

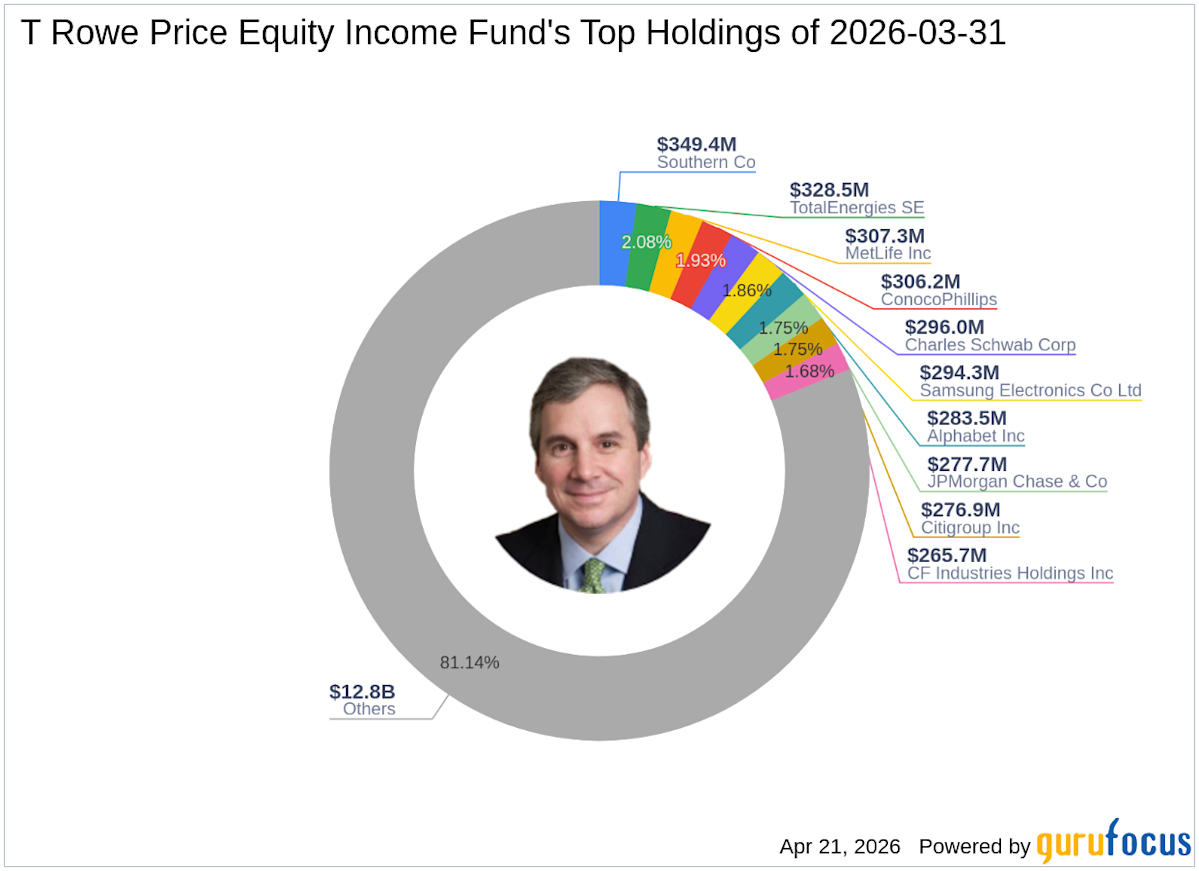
T Rowe Price Equity Income Fund's Q1 2026 Investment Moves
- New Stock Additions: In Q1 2026, T Rowe Price Equity Income Fund added a total of 8 stocks, with AstraZeneca PLC (NYSE:AZN) being the largest addition at 665,000 shares valued at $131.15 million, representing 0.83% of the portfolio, indicating confidence in the biopharmaceutical sector.
- Key Position Increases: The fund increased stakes in 37 stocks, notably Rayonier Inc (NYSE:RYN) with an additional 3,090,285 shares, a 92.64% increase, bringing total holdings to 6,426,000 shares, reflecting optimism in the forestry and real estate markets.
- Complete Exits: The fund completely exited 8 holdings in Q1 2026, including AstraZeneca PLC (NYSE:AZN) and Cummins Inc (NYSE:CMI), resulting in a -0.77% and -0.24% impact on the portfolio respectively, indicating a reassessment of these companies' prospects.
- Significant Reductions: The fund reduced positions in 78 stocks, particularly cutting Accenture PLC (NYSE:ACN) by 216,000 shares, a 53.33% decrease, reflecting a cautious outlook on its future performance, especially as the stock has returned -29.15% over the past three months.

Analysis of the Importance of Market Capitalization
- Market Capitalization Comparison: T. Rowe Price Group Inc has a market cap of $20.54 billion compared to Leidos Holdings Inc at $19.87 billion, allowing investors to more accurately assess the relative value of both companies in the market.
- Investor Misconceptions: Many beginners mistakenly believe that a higher stock price indicates a higher company value, but market capitalization provides a true basis for comparison, helping investors avoid this misunderstanding and make more informed investment decisions.
- Impact of Size: Market capitalization not only affects a company's ranking among peers but also determines which mutual funds and ETFs are willing to hold the stock, particularly as large funds tend to favor companies with market caps exceeding $10 billion.
- Market Performance Divergence: On the latest trading day, TROW's stock rose approximately 1.6%, while LDOS fell about 0.9%, reflecting differing investor sentiment and expectations for the two companies.
T. Rowe Price Reports $1.71 Trillion AUM Decline Amid Outflows
- AUM Decline: As of the end of March, T. Rowe Price's assets under management (AUM) fell to $1.71 trillion from $1.80 trillion at the end of the previous month, indicating a negative impact from market volatility on the company's asset base.
- Outflow Trends: The firm recorded net outflows of $3.2 billion in March, a decrease from $5.3 billion in the prior month, suggesting that while outflows continue, the pace may be slowing, potentially indicating a slight improvement in investor sentiment.
- Asset Class Breakdown: By March 31, equity AUM stood at $810 billion, fixed income (including money market) at $215 billion, multi-asset at $625 billion, and alternatives at $60 billion, illustrating the company's diversified asset allocation.
- Market Impact: The S&P 500 Index declined by 5.09% in March, closing at 6,528.47 points, which may have exacerbated investor outflows and further impacted the firm's AUM figures.
T. Rowe Price Reports $1.71 Trillion AUM with March Outflows
- Assets Under Management: As of March 31, 2026, T. Rowe Price reported $1.71 trillion in assets under management, down from $1.80 trillion in February 2026, indicating the impact of market volatility on asset values.
- Net Outflows: The firm experienced net outflows of $3.2 billion in March 2026 and $13.7 billion for the first quarter, suggesting that investors are withdrawing funds amid uncertain market conditions, which could affect the company's liquidity and future investment capabilities.
- Asset Class Distribution: The asset management breakdown shows $810 billion in equities, $215 billion in fixed income, and $625 billion in multi-asset strategies, reflecting the firm's ongoing commitment to diversification in investment strategies to navigate market fluctuations.
- Retirement Portfolios: The target date retirement portfolios held $561 billion, remaining stable, which underscores the company's leadership in retirement investment despite the overall asset decline, continuing to attract client trust and investments.

T. Rowe Price Reports March AUM and Outflows
- Assets Under Management: As of March 31, 2026, T. Rowe Price reported $1.71 trillion in assets under management, a decline from $1.80 trillion the previous month, indicating the impact of market volatility on asset management.
- Net Outflows: The firm experienced net outflows of $3.2 billion in March 2026, totaling $13.7 billion for the first quarter, reflecting a cautious investor sentiment in uncertain market conditions that may affect short-term earnings.
- Asset Class Distribution: The asset breakdown includes $810 billion in equities, $215 billion in fixed income, and $625 billion in multi-asset portfolios, demonstrating the firm's ongoing efforts in diversifying investment strategies to adapt to market changes.
- Retirement Portfolios: The target date retirement portfolios maintained assets of $561 billion, indicating the firm's strong position in retirement investments and its commitment to clients' long-term interests.

T. Rowe Price Faces Market Challenges and Opportunities
- Market Volatility Impact: With the market down in 2026, T. Rowe Price's stock has declined approximately 10% year-to-date, reflecting its performance's high correlation with market fluctuations, leading to a cautious outlook from investors.
- Outflow Pressure: The company reported $25.5 billion in outflows in Q4, primarily due to the down market prompting investor redemptions, which not only affects asset management scale but also exacerbates revenue decline risks.
- Stable Dividend Growth: Despite challenges, T. Rowe Price has increased its dividend for 40 consecutive years, recently raising it by 2% to $1.30 per share, demonstrating its strong financial position and sustainable cash flow, with a dividend yield of 5.59%.
- Active Management Advantage: In the context of increasing market uncertainty, T. Rowe Price's active management strategy may regain attention, particularly with its newly launched active ETFs, which could attract more institutional investors looking for robust track records.
T Rowe Price Equity Income Fund's Q1 2026 Investment Moves
- New Stock Additions: In Q1 2026, T Rowe Price Equity Income Fund added a total of 8 stocks, with AstraZeneca PLC (NYSE:AZN) being the largest addition at 665,000 shares valued at $131.15 million, representing 0.83% of the portfolio, indicating confidence in the biopharmaceutical sector.
- Key Position Increases: The fund increased stakes in 37 stocks, notably Rayonier Inc (NYSE:RYN) with an additional 3,090,285 shares, a 92.64% increase, bringing total holdings to 6,426,000 shares, reflecting optimism in the forestry and real estate markets.
- Complete Exits: The fund completely exited 8 holdings in Q1 2026, including AstraZeneca PLC (NYSE:AZN) and Cummins Inc (NYSE:CMI), resulting in a -0.77% and -0.24% impact on the portfolio respectively, indicating a reassessment of these companies' prospects.
- Significant Reductions: The fund reduced positions in 78 stocks, particularly cutting Accenture PLC (NYSE:ACN) by 216,000 shares, a 53.33% decrease, reflecting a cautious outlook on its future performance, especially as the stock has returned -29.15% over the past three months.
Analysis of the Importance of Market Capitalization
- Market Capitalization Comparison: T. Rowe Price Group Inc has a market cap of $20.54 billion compared to Leidos Holdings Inc at $19.87 billion, allowing investors to more accurately assess the relative value of both companies in the market.
- Investor Misconceptions: Many beginners mistakenly believe that a higher stock price indicates a higher company value, but market capitalization provides a true basis for comparison, helping investors avoid this misunderstanding and make more informed investment decisions.
- Impact of Size: Market capitalization not only affects a company's ranking among peers but also determines which mutual funds and ETFs are willing to hold the stock, particularly as large funds tend to favor companies with market caps exceeding $10 billion.
- Market Performance Divergence: On the latest trading day, TROW's stock rose approximately 1.6%, while LDOS fell about 0.9%, reflecting differing investor sentiment and expectations for the two companies.
T. Rowe Price Reports $1.71 Trillion AUM Decline Amid Outflows
- AUM Decline: As of the end of March, T. Rowe Price's assets under management (AUM) fell to $1.71 trillion from $1.80 trillion at the end of the previous month, indicating a negative impact from market volatility on the company's asset base.
- Outflow Trends: The firm recorded net outflows of $3.2 billion in March, a decrease from $5.3 billion in the prior month, suggesting that while outflows continue, the pace may be slowing, potentially indicating a slight improvement in investor sentiment.
- Asset Class Breakdown: By March 31, equity AUM stood at $810 billion, fixed income (including money market) at $215 billion, multi-asset at $625 billion, and alternatives at $60 billion, illustrating the company's diversified asset allocation.
- Market Impact: The S&P 500 Index declined by 5.09% in March, closing at 6,528.47 points, which may have exacerbated investor outflows and further impacted the firm's AUM figures.
T. Rowe Price Reports $1.71 Trillion AUM with March Outflows
- Assets Under Management: As of March 31, 2026, T. Rowe Price reported $1.71 trillion in assets under management, down from $1.80 trillion in February 2026, indicating the impact of market volatility on asset values.
- Net Outflows: The firm experienced net outflows of $3.2 billion in March 2026 and $13.7 billion for the first quarter, suggesting that investors are withdrawing funds amid uncertain market conditions, which could affect the company's liquidity and future investment capabilities.
- Asset Class Distribution: The asset management breakdown shows $810 billion in equities, $215 billion in fixed income, and $625 billion in multi-asset strategies, reflecting the firm's ongoing commitment to diversification in investment strategies to navigate market fluctuations.
- Retirement Portfolios: The target date retirement portfolios held $561 billion, remaining stable, which underscores the company's leadership in retirement investment despite the overall asset decline, continuing to attract client trust and investments.
T. Rowe Price Reports March AUM and Outflows
- Assets Under Management: As of March 31, 2026, T. Rowe Price reported $1.71 trillion in assets under management, a decline from $1.80 trillion the previous month, indicating the impact of market volatility on asset management.
- Net Outflows: The firm experienced net outflows of $3.2 billion in March 2026, totaling $13.7 billion for the first quarter, reflecting a cautious investor sentiment in uncertain market conditions that may affect short-term earnings.
- Asset Class Distribution: The asset breakdown includes $810 billion in equities, $215 billion in fixed income, and $625 billion in multi-asset portfolios, demonstrating the firm's ongoing efforts in diversifying investment strategies to adapt to market changes.
- Retirement Portfolios: The target date retirement portfolios maintained assets of $561 billion, indicating the firm's strong position in retirement investments and its commitment to clients' long-term interests.
T. Rowe Price Faces Market Challenges and Opportunities
- Market Volatility Impact: With the market down in 2026, T. Rowe Price's stock has declined approximately 10% year-to-date, reflecting its performance's high correlation with market fluctuations, leading to a cautious outlook from investors.
- Outflow Pressure: The company reported $25.5 billion in outflows in Q4, primarily due to the down market prompting investor redemptions, which not only affects asset management scale but also exacerbates revenue decline risks.
- Stable Dividend Growth: Despite challenges, T. Rowe Price has increased its dividend for 40 consecutive years, recently raising it by 2% to $1.30 per share, demonstrating its strong financial position and sustainable cash flow, with a dividend yield of 5.59%.
- Active Management Advantage: In the context of increasing market uncertainty, T. Rowe Price's active management strategy may regain attention, particularly with its newly launched active ETFs, which could attract more institutional investors looking for robust track records.