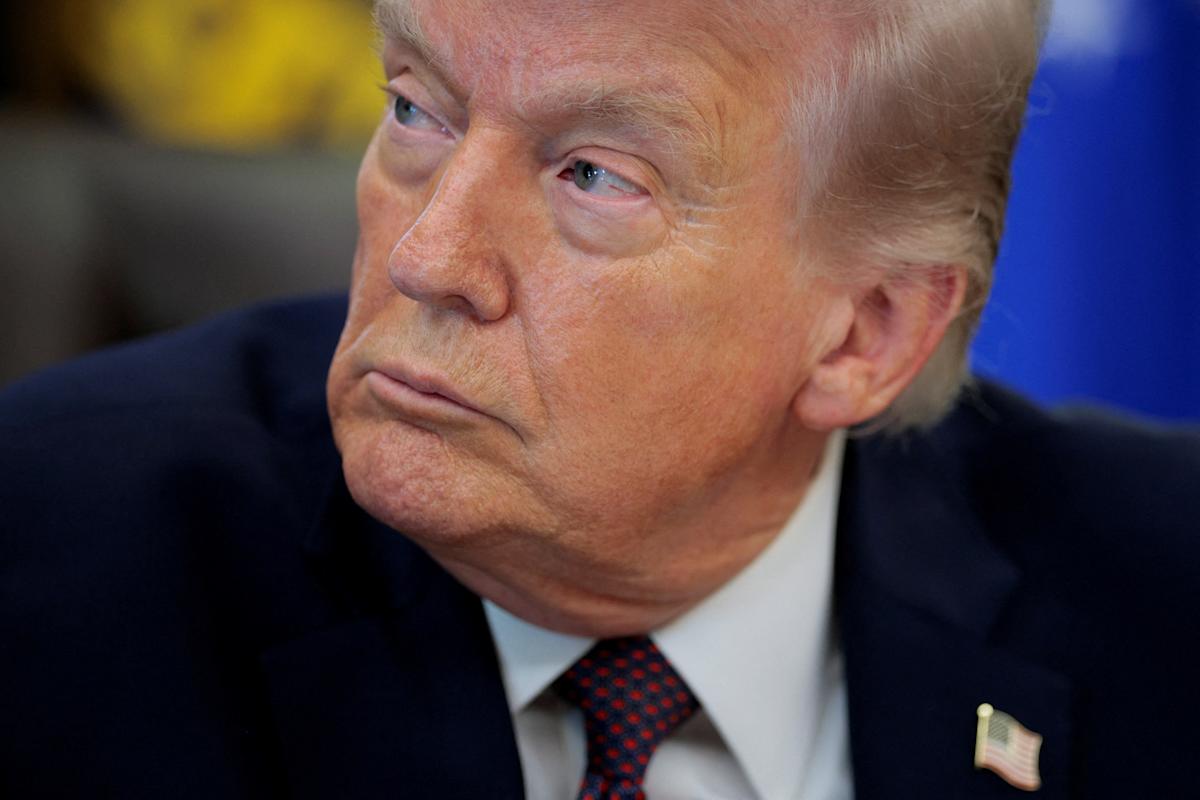
Trump Warns Iran, Crypto Market Reacts Sharply


- Market Decline: Following Trump's warning that Iran's proposal was insufficient to avert military strikes, the crypto market fell by 2%, dropping to $2.42 trillion, indicating investor sensitivity to geopolitical risks.
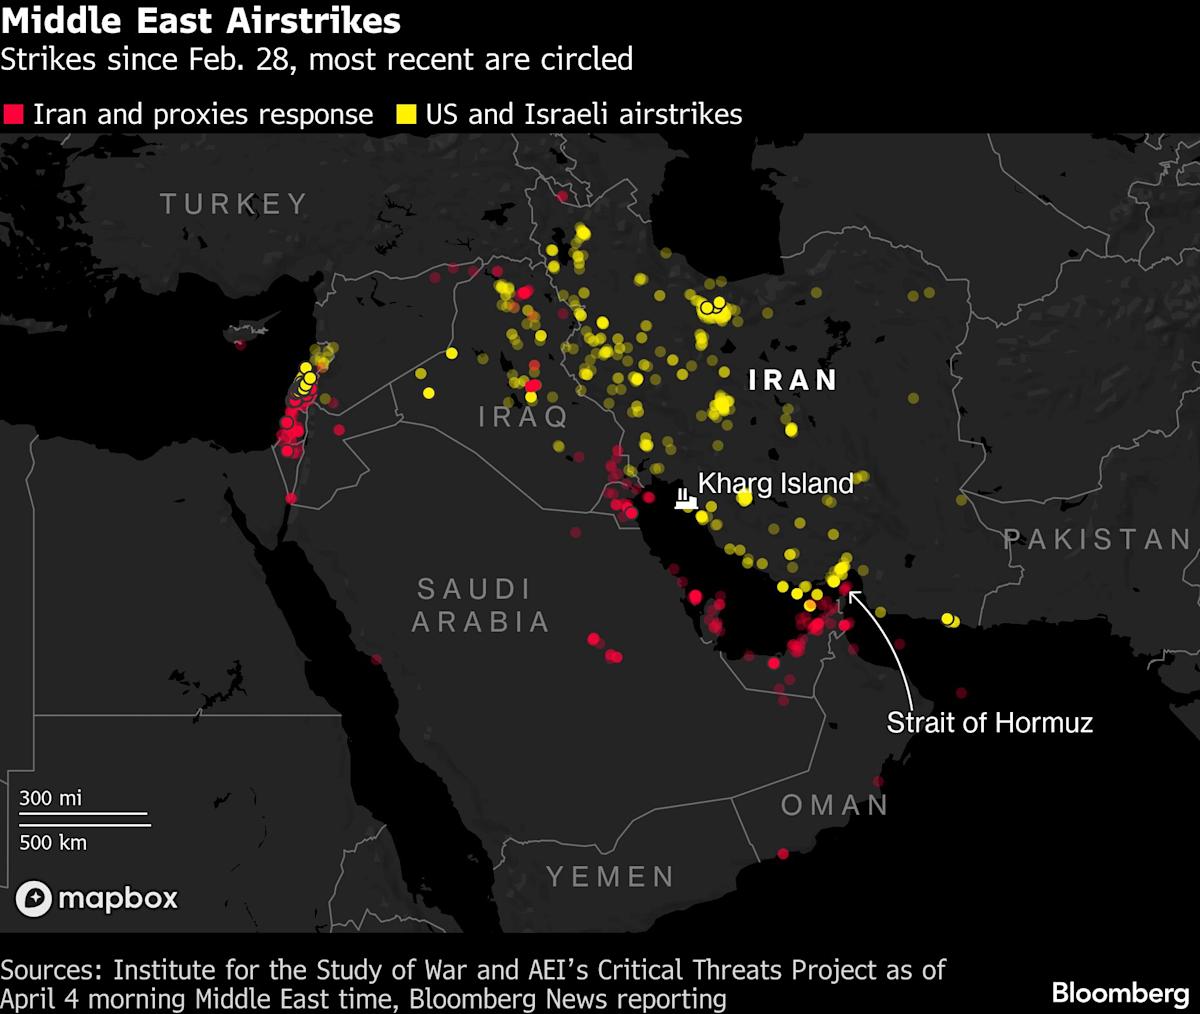
- Oil Price Surge: The blockade of the Strait of Hormuz has threatened global energy supplies, causing oil prices to skyrocket and raising inflation concerns, which in turn affects the stability of both crypto and traditional markets.
- Bitcoin Volatility: Bitcoin retreated from the psychological resistance of $70,000 to $68,546 after Trump confirmed the continuation of military actions, reflecting a cautious sentiment among investors towards risk assets.
- Investor Sentiment: Despite initial signs of a peace proposal, market uncertainty regarding future developments has led traders to remain on the sidelines, with major crypto assets like ETH, BNB, and XRP down by 1-2%.
Get Real-Time Alerts for Any Crypto Movement
Technical Analysis for BTC
Technical Sentiment Analysis for Bitcoin (BTC). As of , Bitcoin (BTC) is exhibiting a Sell technical sentiment. Our proprietary analysis, which aggregates 5 technical signals, shows that 1 indicators are flashing buy, while 4 are indicating sell.
Momentum Indicators: RSI, MACD & Overbought/Oversold Status. Currently, the Relative Strength Index (RSI) for BTC stands at -, which suggests a Neutral condition. Meanwhile, the MACD (12, 26) indicator is at -, providing a Neutral signal for short-term momentum. Other oscillators like the Stochastic Oscillator at - and the Commodity Channel Index (CCI) at - further confirm a - outlook for the crypto.
Support, Resistance & Moving Averages. From a structural perspective, BTC is trading below its 60-day moving average of $- and below its 200-day long-term moving average of $-. Key price levels to watch include the immediate resistance at $- and strong support at $-. A break above $- could signal a bull continuation, while falling below $- may test the next Fibonacci floor at $-.
Bitcoin (BTC) Support & Resistance Level
| Name | S3 | S2 | S1 | Pivot Points | R1 | R2 | R3 |
|---|---|---|---|---|---|---|---|
| Classic | 59633.579 | 62316.79 | 64985.039 | 67668.25 | 70336.499 | 73019.71 | 75687.959 |
| Fibonacci | 62316.79 | 64361.047 | 65623.992 | 67668.25 | 69712.507 | 70975.452 | 73019.71 |
About BTC
About the author