
Crypto Radar is your AI-powered trading assistant for crypto perpetuals. It combines real-time market signals, structured trade setups, and leverage guidance to help you trade with confidence—without staying glued to the charts.
This guide walks you through how it works and how to get the most out of each feature.
0) Why it was built
Crypto Radar is built for traders who are looking for high-return opportunities within a short timeframe—typically within 1 to 3 days—and who are comfortable taking on higher risk to capture them.
In fast-moving crypto markets, short-term swings can create outsized profit potential. But they also demand precise timing, strict discipline, and speed.
Most traders struggle with three things:
Entering at the right time
Cutting losses quickly
Taking profits before reversals
Crypto Radar solves this by doing the heavy lifting for you. It pre-defines where to enter, where to exit, and how much leverage is suitable based on our confidence scoring and volatility filters. This allows you to focus purely on execution—fast, structured, and with a clear plan.
1) Key Stats: Your Market Snapshot
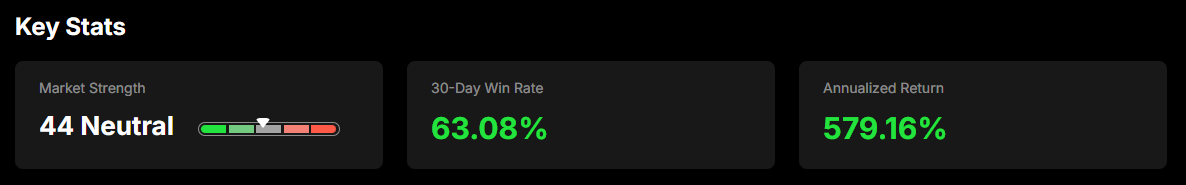
At the top of the dashboard, you'll see three key metrics:
Market Strength A real-time score from 0 to 100 that reflects the overall strength or weakness of the crypto market. It's divided into five categories:
Very Weak (0–20): Risk-off conditions, low momentum
Weak (21–40): Cautious sentiment, failed breakouts are common
Neutral (41–60): No clear bias—sideways or choppy
Strong (61–80): Positive sentiment, trends more likely to hold
Very Strong (81–100): High momentum, breakout conditions
30-Day Win Rate The percentage of all closed signals over the past 30 days that ended with a profit.
Annualized Return Theoretical return based on past signals, normalized to an annual rate. Use this to understand recent performance—but remember, past performance is not a guarantee of future results.
Together, these stats help you decide when to lean into signals—or when to sit tight.
2) Signal Cards: Your Trade Compass
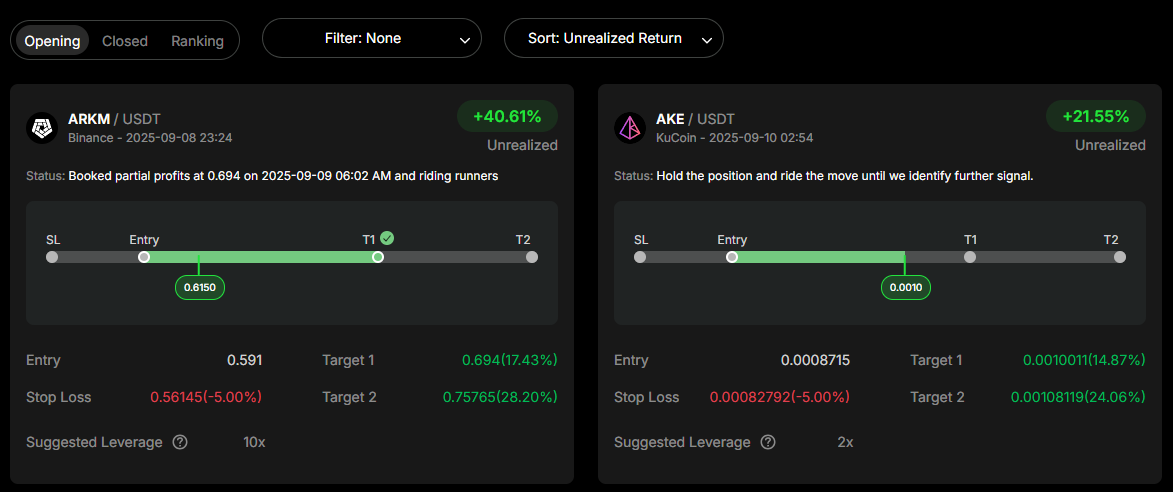
Each card is a complete, actionable plan:
Header & Status: pair, exchange, signal time, and a short update of signal status.
Entry: This is the recommended entry price range. Most traders use a limit or conditional order to open a position inside this band. Avoid chasing if price has already moved far beyond it.
Stop Loss: This is your protection level. If price hits this level, the signal is considered invalid and you should exit.
Target 1: This is your first take-profit level. Once price reaches here, it's recommended to close 50% of your position and lock in gains.
Target 2: This is the final target. You can close the remaining 50% here, or exit earlier if the trend shows weakness
Suggested Leverage: confidence-weighted leverage derived from our proprietary signal model and volatility filters.
Unrealized / Realized Return: This is the leverage return, meaning how much profit you've made relative to your position margin, not just price movement.
Together, these levels help you stay structured and emotion-free:
You know where to get in,
You know where to get out if wrong,
You know where to take profits if right.
3) How to use it
Step 1: Check “Key Stats.” If Market Strength is neutral/strong, you can be more selective with longs; when weak, tighten risk or stand aside.
Step 2: Pick a Signal Go to the Opening tab and select a card that fits your trading window.
Step 3: Plan the Trade
Place entry orders in the given range.
Set Stop Loss at the card's Suggested stop level.
Scale out at Target1 and Target 2 (commonly 50% / 50%).
Use the Suggested Leverage band as a guide—confidence-weighted, not mandatory.
Step 4: Manage.
If Target1 hits, you can secure partial profit; if price returns to entry afterward, close the remainder.
If a “peak”/exhaustion condition appears while you have floating profit, consider closing the rest.
If Stop Loss hits, exit—don't widen stops.
4) Tabs & Sorting
Opening: live signals you can follow
Closed: completed signals (shows Realized Return and whether it hit targets or Stop Loss)
Ranking: leaderboard by ticker: total signals, win rate, and return performance
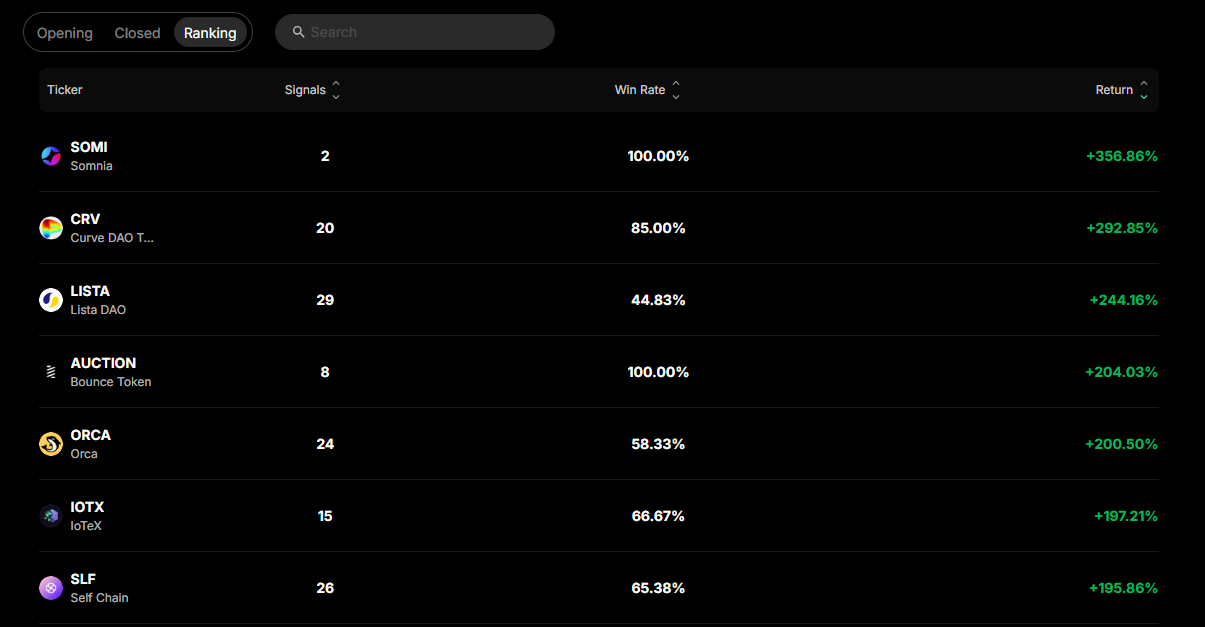
You can sort each list by return or time to quickly find the strongest opportunities.
5) Best practices
Size by risk, not gut feel. Decide your max loss per trade. Match leverage and margin accordingly.
Don't chase. Skip signals that have already moved far beyond the entry range. It's always best to double-check the signal's validity using AI Insights (e.g., “Should I Buy” or “Technical Analysis”).
Honor stops. A failed setup is part of the game; the edge lives in discipline.
Review Closed & Ranking weekly. Use the Closed and Ranking tabs to understand which tickers or signals are currently working best.
Final Thoughts
Crypto Radar is designed to simplify short-term trading. It maps out your entry, your exit, and your leverage—so you can act with speed and structure. Follow the signals, manage risk tightly, and let the AI do the heavy lifting.
Stay disciplined. Stay selective. And use Radar as your edge in the fast-moving crypto market.