Intellectia LogoIntellectia
Product
Resources
Markets
Pricing
Log inTry for Free
Intellectia Logo
Log in
Intellectia Logo

Product

Features
Financial AI Agent
Stock Technical Analysis
Stock Monitor
Hedge Fund Tracker
Crypto Technical Analysis
AI Screener
Trading Strategies
AI Stock Picker
Swing Trading
Earnings Trading
Stock Chart Patterns
Daytrading Center

Resources

Learn
Blog
Earnings
Tutorial
Help Center
Company
About Us
Contact
Press
Reward Program
Partner Program
Dividend Calculator
Dividend Yield Calculator
Options Profit Calculator
Compare
TradingView
SeekingAlpha

Markets

Trending Stocks
Hot Crypto
Trending News
All Stocks
Pricing
Start for Free
  1. Home
  2. >
  3. Stock
  4. >
  5. TKR
stocks logo

TKR

-
Add to WatchlistAdvanced Chart
$
0.000
0(0.000%)1D
High
--
Open
--
VWAP
--
Vol
--
Mkt Cap
--
Low
--
Amount
--
EV/EBITDA(TTM)
--
Total Shares
--
EV
--
EV/OCF(TTM)
--
P/S(TTM)
--

Market Estimates

Earnings Estimates
Earnings Estimates
Revenue
YoY Chg
EPS
YoYChg
FY2025Q2
FY2025Q3
FY2025Q4
1.15B
-2.85%
1.383
-15.17%
1.12B
-0.97%
1.281
+4.18%
1.08B
+0.88%
1.230
+6.03%
Estimates Revision
The market is revising Upward the revenue expectations for The Timken Company (TKR) for FY2025, with the revenue forecasts being adjusted by 0.46% over the past three months. During the same period, the stock price has changed by 31.52%.
Revenue Estimates for FY2025
Revise Upward
up Image
+0.46%
In Past 3 Month
EPS Estimates for FY2025
Revise Downward
down Image
-3.79%
In Past 3 Month
Stock Price
Go Up
up Image
+31.52%
In Past 3 Month
7 Analyst Rating
down Image0
Wall Street analysts forecast TKR stock price to fall over the next 12 months. According to Wall Street analysts, the average 1-year price target for TKR is 76.75 USD with a low forecast of 65.00 USD and a high forecast of 88.00  USD. However, analyst price targets are subjective and often lag stock prices, so investors should focus on the objective reasons behind analyst rating changes, which better reflect the company's fundamentals.
3 Buy
4 Hold
0 Sell
Moderate Buy
down Image0
Current: 79.160
sliders
Low
65.00
Averages
76.75
High
88.00
down Image0
Current: 79.160
sliders
Low
65.00
Averages
76.75
High
88.00
Citi
Buy
upgrade
$75 -> $80
2025-06-24
Reason
Citi
Price Target
$75 -> $80
2025-06-24
upgrade
Buy
Reason
Citi raised the firm's price target on Timken to $80 from $75 and keeps a Buy rating on the shares. The firm updated price targets and its machinery views to reflect the current environment.
Citi
Buy
maintain
$70 -> $75
2025-05-08
Reason
Citi
Price Target
$70 -> $75
2025-05-08
maintain
Buy
Reason
Citi raised the firm's price target on Timken to $75 from $70 and keeps a Buy rating on the shares. The firm updated its model post the Q1 report to reflect more constructive revenue growth estimates offset by lower margin assumptions, which are impacted by tariffs.
DA Davidson
Michael Shlisky
Strong Buy
to
Hold
Downgrades
n/a
2025-04-21
Reason
DA Davidson
Michael Shlisky
Price Target
n/a
2025-04-21
Downgrades
Strong Buy
to
Hold
Reason
Loop Capital
Chris Dankert
Hold
Maintains
$85 → $65
2025-04-17
Reason
Loop Capital
Chris Dankert
Price Target
$85 → $65
2025-04-17
Maintains
Hold
Reason
Loop Capital lowered the firm's price target on Timken to $65 from $85 and keeps a Hold rating on the shares as part of a broader research note on Industrials. The firm's spot checks suggest that end demand has softened slightly, even though this is being more that outmatched by the favorable move in FX rates over the past several months, the analyst tells investors in a research note. Early price increase announcements and the expectation of additional increases more than offsets this softness for now, Loop adds.
Morgan Stanley
Angel Castillo
Buy
Maintains
$94 → $88
2025-04-16
Reason
Morgan Stanley
Angel Castillo
Price Target
$94 → $88
2025-04-16
Maintains
Buy
Reason
Citigroup
Kyle Menges
Strong Buy
Maintains
$95 → $70
2025-04-08
Reason
Citigroup
Kyle Menges
Price Target
$95 → $70
2025-04-08
Maintains
Strong Buy
Reason
Citi analyst Kyle Menges lowered the firm's price target on Timken to $70 from $95 and keeps a Buy rating on the shares as part of a Q1 earnings preview for U.S. machinery. The firm reduced estimates across the board given the view that the U.S. capex outlook is most at risk from Trump administration's tariffs. Citi anticipates the Trump administration's tariffs to negatively impact U.S. farmers' exports and profits, likely extending the agriculture downcycle in North America.
See All Ratings

Valuation Metrics

The current forward P/E ratio for Timken Co (TKR.N) is 14.32, compared to its 5-year average forward P/E of 12.62. For a more detailed relative valuation and DCF analysis to assess Timken Co 's fair value, click here.
    Forward PE
    Forward EV/EBITDA
    Forward PS

Forward PE

The forward P/E ratio is a valuation metric that divides a company's current stock price by its estimated future earnings per share over the next 12 months.
StronglyUndervaluedUndervaluedFairOvervaluedStronglyOvervalueddotted line Image
Fair
5Y Average PE
12.62
Current PE
14.32
Overvalued PE
14.41
Undervalued PE
10.82

Forward EV/EBITDA

The forward EV/EBITDA ratio is a valuation metric that divides a company's enterprise value (EV) by its estimated future earnings before interest, taxes, depreciation, and amortization (EBITDA) over the next 12 months.
StronglyUndervaluedUndervaluedFairOvervaluedStronglyOvervalueddotted line Image
Fair
5Y Average EV/EBITDA
8.51
Current EV/EBITDA
9.00
Overvalued EV/EBITDA
9.38
Undervalued EV/EBITDA
7.63

Forward PS

The forward P/S ratio is a valuation metric that divides a company's current stock price by its estimated future sales (or revenue) per share over the next 12 months.
StronglyUndervaluedUndervaluedFairOvervaluedStronglyOvervalueddotted line Image
Fair
5Y Average PS
1.21
Current PS
1.18
Overvalued PS
1.37
Undervalued PS
1.05

Financials

Annual
Quarterly
N/A
Total Revenue
N/A
Operating Profit
N/A
Net Income after Tax
N/A
EPS - Diluted
N/A
Free Cash Flow
N/A
Gross Profit Margin - %
N/A
FCF Margin - %
N/A
Net Margin - %
N/A
ROIC

Trading Trends

    Insider
    Hedge Fund
    Congress Trading
Insider
Insiders are Neutral. There are no significant trading trends over the last month.
Sold
Bought
Hedge Fund
Hedge Funds are Neutral. There are no significant trading trends over the last quarter.
Sold
Bought
Congress Trading
Congress are Neutral. There are no significant trading trends over the last month.
Sold
Bought
Insider
Insiders are Neutral. There are no significant trading trends over the last month.
Sold
Bought

TKR News & Events

Events Timeline

(ET)
2025-06-02
06:51:55
Timken appoints Timothy Graham as president, Industrial Motion
select
2025-05-02 (ET)
2025-05-02
08:31:34
Timken raises quarterly dividend 3% to 35c per share
select
2025-04-30 (ET)
2025-04-30
06:57:07
Timken cuts FY25 adjusted EPS view to $5.10-$5.60 from $5.30-$5.80
select
Sign Up For More Events

News

Preview
3.0
07-10Newsfilter
Timken to Announce Second-Quarter 2025 Financial Results on July 30
  • Upcoming Financial Results: The Timken Company will release its Q2 2025 financial results on July 30, 2025, and will host a conference call to discuss the performance with investors and analysts.

  • Company Overview: Timken is a global leader in engineered bearings and industrial motion, with $4.6 billion in sales in 2024 and operations in 45 countries, employing around 19,000 people.

Preview
2.0
07-02NASDAQ.COM
Bullish Two Hundred Day Moving Average Cross - TKR
  • Stock Performance Overview: TKR's stock has a 52-week low of $56.20 and a high of $90.49, with the last trade recorded at $75.91.

  • Disclaimer on Opinions: The views expressed in the article are those of the author and do not necessarily represent Nasdaq, Inc.

Preview
4.0
06-25Benzinga
The Analyst Verdict: Timken In The Eyes Of 10 Experts
  • Analyst Ratings Overview: Timken has received mixed analyst ratings over the past three months, with a total of 10 analysts providing opinions ranging from bullish to bearish. The average 12-month price target is $76.7, reflecting a downward trend compared to previous estimates.

  • Company Performance Insights: Timken faces challenges in revenue growth, net margin, return on equity, and return on assets, all of which are below industry averages. Additionally, the company's higher debt-to-equity ratio indicates increased financial risk.

Sign Up For More News

People Also Watch

FAQ

arrow icon

What is Timken Co (TKR) stock price today?

The current price of TKR is 79.16 USD — it has increased 0.04 % in the last trading day.

arrow icon

What is Timken Co (TKR)'s business?

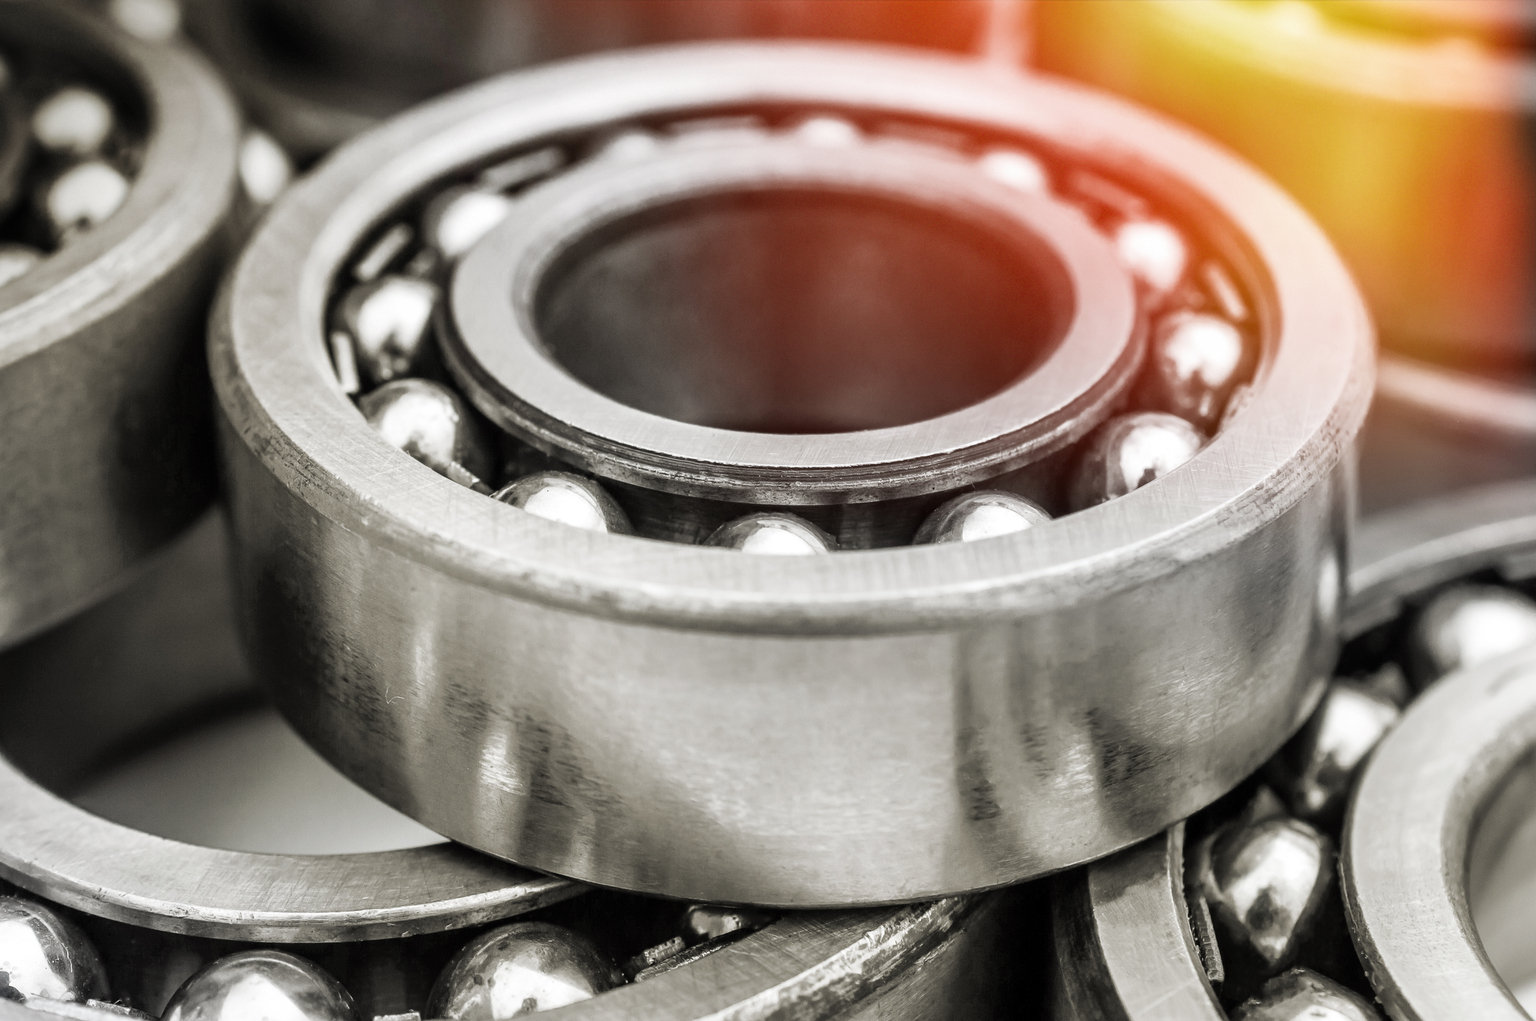
The Timken Company designs and manages a portfolio of engineered bearings and industrial motion products, and provides related services. Its Engineered Bearings segment features a range of product designs serving original equipment manufacturers and end-users. Its portfolio features Timken, GGB, and Fafnir brands and serves customers across industries, including wind energy, agriculture, construction, food and beverage, metals and mining, automotive and truck, aerospace, rail and more. The Industrial Motion segment includes a portfolio of engineered products, including industrial drives, automatic lubrication systems, linear motion products and systems, chains, belts, couplings, filtration systems and industrial clutches and brakes. Its portfolio features brands such as Philadelphia Gear, Cone Drive, Spinea, Rollon, Nadella, Groeneveld, BEKA, Des-Case, Diamond, Drives, Timken Belts, Lovejoy, PT Tech, Lagersmit, and CGI. It also offers specialty filtration products, augers and others.

arrow icon

What is the price predicton of TKR Stock?

Wall Street analysts forecast TKR stock price to fall over the next 12 months. According to Wall Street analysts, the average 1-year price target for TKR is 76.75 USD with a low forecast of 65.00 USD and a high forecast of 88.00 USD. However, analyst price targets are subjective and often lag stock prices, so investors should focus on the objective reasons behind analyst rating changes, which better reflect the company's fundamentals.

arrow icon

What is Timken Co (TKR)'s revenue for the last quarter?

Timken Co revenue for the last quarter amounts to 1.14B USD, decreased -4.20 % YoY.

arrow icon

What is Timken Co (TKR)'s earnings per share (EPS) for the last quarter?

Timken Co. EPS for the last quarter amounts to 1.11 USD, decreased -23.97 % YoY.

arrow icon

What changes have occurred in the market's expectations for Timken Co (TKR)'s fundamentals?

The market is revising Upward the revenue expectations for The Timken Company (TKR) for FY2025, with the revenue forecasts being adjusted by 0.46% over the past three months. During the same period, the stock price has changed by 31.52%.
arrow icon

How many employees does Timken Co (TKR). have?

Timken Co (TKR) has 19000 emplpoyees as of July 19 2025.

arrow icon

What is Timken Co (TKR) market cap?

Today TKR has the market capitalization of 5.54B USD.

Intellectia LogoIntellectiaIntellectia LogoIntellectia

Redefine Your Investment Decisions

TwitterTwitterYoutubeYoutubeQuoraQuoraDiscordDiscordLinkedinLinkedinTelegramTelegram

Copyright © 2025 Intellectia.AI. All Rights Reserved.

pci certified logo
Company
HomeContactAbout UsNews Release
Compare
TradingViewSeeking Alpha
Features
Financial AI AgentStock Technical AnalysisStock MonitorHedge Fund TrackerCrypto Technical AnalysisAI ScreenerDaytrading Center
Strategies
AI Stock PickerSwing TradingStock Chart PatternsEarnings Trading
Free Tools
Dividend CalculatorDividend Yield CalculatorOptions Profit Calculator
Resource
BlogTutorialEarningsTrending StocksCrypto MarketPartner ProgramTerms of UsePrivacy PolicySitemap
Start for Free