
EH
EHang Holdings Ltd
- Overview
- Forecast
- Valuation
- Earnings

Line
|

Candle
1D
5D
1M
3M
6M
YTD
1Y
5Y
High
17.870
Open
17.660
VWAP
17.65
Vol
745.53K
Mkt Cap
1.28B
Low
17.430
Amount
13.16M
EV/EBITDA(TTM)
--
Total Shares
63.56M
EV
1.15B
EV/OCF(TTM)
--
P/S(TTM)
21.13
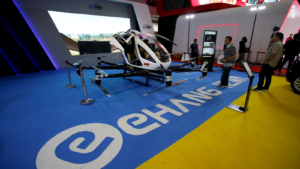
EHang Holdings Ltd is an investment holding company primarily engaged in the provision of unmanned aerial vehicle (UAV) systems and solutions. The Company operates three businesses. The air mobility solutions business is engaged in providing customers with electric vertical takeoff and landing (eVTOL) aircraft products, solutions and operational services for air transportations of passengers, cargos, emergencies and others. The smart city management solutions business is engaged in providing integrated digital platform with customized UAV models as turn-key solutions for monitoring and management across many ordinary municipal functions and public utilities, such as traffic management, powerline inspection, environmental monitoring, firefighting, emergency rescue, aerial mapping and others. The aerial media solutions business is engaged in providing aerial media performances, also known as drone light shows. The Company conducts its business in the domestic and overseas markets.
Show More
Market Estimates
Earnings Estimates
Revenue
YoY Chg
EPS
YoYChg
FY2025Q2
FY2025Q3
FY2025Q4
180.98M
+77.4%
--
--
285.60M
+122.9%
--
--
375.19M
+128.39%
--
--
Estimates Revision
The market is revising Downward the revenue expectations for EHang Holdings Limited (EH) for FY2025, with the revenue forecasts being adjusted by -0.98% over the past three months. During the same period, the stock price has changed by -7.33%.
Revenue Estimates for FY2025
Revise Downward

-0.98%
In Past 3 Month
Stock Price
Go Down

-7.33%
In Past 3 Month
2 Analyst Rating

51.43% Upside
Wall Street analysts forecast EH stock price to rise over the next 12 months. According to Wall Street analysts, the average 1-year price target for EH is 27.00 USD with a low forecast of 24.00 USD and a high forecast of 30.00 USD. However, analyst price targets are subjective and often lag stock prices, so investors should focus on the objective reasons behind analyst rating changes, which better reflect the company's fundamentals.
2 Buy
0 Hold
0 Sell
Moderate Buy

51.43% Upside
Current: 17.830

Low
24.00
Averages
27.00
High
30.00

51.43% Upside
Current: 17.830

Low
24.00
Averages
27.00
High
30.00
BofA
Buy
maintain
$26 -> $24
2025-05-27
Reason
BofA
Price Target
$26 -> $24
2025-05-27
maintain
Buy
Reason
BofA lowered the firm's price target on EHang to $24 from $26 and keeps a Buy rating on the shares following a Q1 miss on lower-than-expected sales. Factoring in Q1 results, the firm cut Ehang's 2025 and 2026 volume sales estimates 7% and 8% and cut its 2025 and 2026 non-GAAP net profit forecasts by 63% and 12%, respectively.
BofA
Fiona Liang
Buy
initiated
$26
2025-05-13
Reason
BofA
Fiona Liang
Price Target
$26
2025-05-13
initiated
Buy
Reason
BofA analyst Fiona Liang initiated coverage of EHang with a Buy rating and $26 price target. According to SMG consulting survey, the company is China's #1 eVTOL aircraft brand, selling passenger/cargo-grade pilotless eVTOL aircraft, and the firm believes that Ehang will sustain its leadership in China's eVTOL aircraft market in the coming 5 years given its advanced technology and licensure head start, the analyst tells investors in a research note.
Deutsche Bank
Edison Yu
Hold
to
Strong Buy
Upgrades
$22 → $20
2025-04-14
Reason
Deutsche Bank
Edison Yu
Price Target
$22 → $20
2025-04-14
Upgrades
Hold
to
Strong Buy
Reason
Deutsche Bank upgraded EHang to Buy from Hold with a $20 price target.
See All Ratings
Valuation Metrics
The current forward P/E ratio for EHang Holdings Ltd (EH.O) is -99.99, compared to its 5-year average forward P/E of -49.40. For a more detailed relative valuation and DCF analysis to assess EHang Holdings Ltd 's fair value, click here.
Forward PE
The forward P/E ratio is a valuation metric that divides a company's current stock price by its estimated future earnings per share over the next 12 months.

N/A
5Y Average PE
-49.40
Current PE
-99.99
Overvalued PE
31.42
Undervalued PE
-130.23
Forward EV/EBITDA
The forward EV/EBITDA ratio is a valuation metric that divides a company's enterprise value (EV) by its estimated future earnings before interest, taxes, depreciation, and amortization (EBITDA) over the next 12 months.

N/A
5Y Average EV/EBITDA
-47.64
Current EV/EBITDA
-153.20
Overvalued EV/EBITDA
3.80
Undervalued EV/EBITDA
-99.07
Forward PS
The forward P/S ratio is a valuation metric that divides a company's current stock price by its estimated future sales (or revenue) per share over the next 12 months.

N/A
5Y Average PS
34.32
Current PS
9.49
Overvalued PS
75.41
Undervalued PS
-6.77
Financials
Annual
Quarterly
FY2025Q1
YoY :
-57.73%
26.09M
Total Revenue
FY2025Q1
YoY :
+36.51%
-89.88M
Operating Profit
FY2025Q1
YoY :
+21.60%
-76.66M
Net Income after Tax
FY2025Q1
YoY :
+8.00%
-0.54
EPS - Diluted
FY2021Q2
YoY :
+37.56%
-63.12M
Free Cash Flow
FY2025Q1
YoY :
+0.92%
62.44
Gross Profit Margin - %
FY2025Q1
N/A
FCF Margin - %
FY2025Q1
YoY :
+192.57%
-300.44
Net Margin - %
Trading Trends
Insider
Insiders are Neutral. There are no significant trading trends over the last month.
Sold
0-3
Months
0.0
USD
0
3-6
Months
0.0
USD
0
6-9
Months
0.0
USD
0
0-12
Months
0.0
USD
0
Bought
0-3
0
0.0
USD
Months
3-6
0
0.0
USD
Months
6-9
0
0.0
USD
Months
0-12
0
0.0
USD
Months
Hedge Fund
Hedge Funds are Neutral. There are no significant trading trends over the last quarter.
Sold
0-3
Months
0.0
Volume
0
3-6
Months
0.0
Volume
0
6-9
Months
0.0
Volume
0
0-12
Months
0.0
Volume
0
Bought
0-3
0
0.0
Volume
Months
3-6
1
9.1K
Volume
Months
6-9
1
26.9K
Volume
Months
0-12
0
0.0
Volume
Months
Congress Trading
Congress are Neutral. There are no significant trading trends over the last month.
Sold
0-3
Months
0.0
USD
0
3-6
Months
0.0
USD
0
6-9
Months
0.0
USD
0
0-12
Months
0.0
USD
0
Bought
0-3
0
0.0
USD
Months
3-6
0
0.0
USD
Months
6-9
0
0.0
USD
Months
0-12
0
0.0
USD
Months
Insider
Insiders are Neutral. There are no significant trading trends over the last month.
Sold
0-3
Months
0.0
USD
0
3-6
Months
0.0
USD
0
6-9
Months
0.0
USD
0
0-12
Months
0.0
USD
0
Bought
0-3
0
0.0
USD
Months
3-6
0
0.0
USD
Months
6-9
0
0.0
USD
Months
0-12
0
0.0
USD
Months
EH News & Events
Events Timeline
2025-08-01 (ET)
2025-08-01
08:16:01
EHang partners with Wanyi Tianxia for long-range UAV cargo flights

2025-07-01 (ET)
2025-07-01
11:44:22
EHang enters partnership agreement with Reignwood Aviation Group

2025-06-30 (ET)
2025-06-30
10:31:49
EHang secures order for 50 units of EH216-2 eVTOL aircraft

Sign Up For More Events
News
8.5
08-07PRnewswireDrone as a Service Market Disrupting Both Government & Commercial Sectors While Experiencing Exponential Growth
7.5
08-01NewsfilterEHang Partners with Wanyi Tianxia to Complete Groundbreaking Long-Range UAV Cargo Flights in the Greater Bay Area with Intercity Round-Trip Between Zhuhai and Guangzhou
8.5
07-31NewsfilterU.S. Drone Industry Investment Surging Amid Sweeping Legislative Reforms
Sign Up For More News
People Also Watch

RDW
Redwire Corp
9.420
USD
+6.80%

GRC
Gorman-Rupp Co
42.700
USD
+3.36%

BKD
Brookdale Senior Living Inc
7.230
USD
+0.14%

FWRD
Forward Air Corp (Delaware)
29.120
USD
+1.93%

AMN
AMN Healthcare Services Inc
17.640
USD
+6.97%

BBAI
BigBear.ai Holdings Inc
5.970
USD
-15.80%

TRS
TriMas Corp
35.670
USD
+2.44%

GOGO
Gogo Inc
12.840
USD
+5.07%

ALX
Alexander's Inc
221.290
USD
+2.51%
FAQ

What is EHang Holdings Ltd (EH) stock price today?
The current price of EH is 17.83 USD — it has increased 0.96 % in the last trading day.

What is EHang Holdings Ltd (EH)'s business?

What is the price predicton of EH Stock?

What is EHang Holdings Ltd (EH)'s revenue for the last quarter?

What is EHang Holdings Ltd (EH)'s earnings per share (EPS) for the last quarter?

What changes have occurred in the market's expectations for EHang Holdings Ltd (EH)'s fundamentals?

How many employees does EHang Holdings Ltd (EH). have?
