
Line
|

Candle
1D
5D
1M
3M
6M
YTD
1Y
5Y
High
1.280
Open
1.240
VWAP
1.26
Vol
422.21K
Mkt Cap
169.86M
Low
1.240
Amount
530.18K
EV/EBITDA(TTM)
11.63
Total Shares
128.87M
EV
567.82M
EV/OCF(TTM)
28.29
P/S(TTM)
0.28
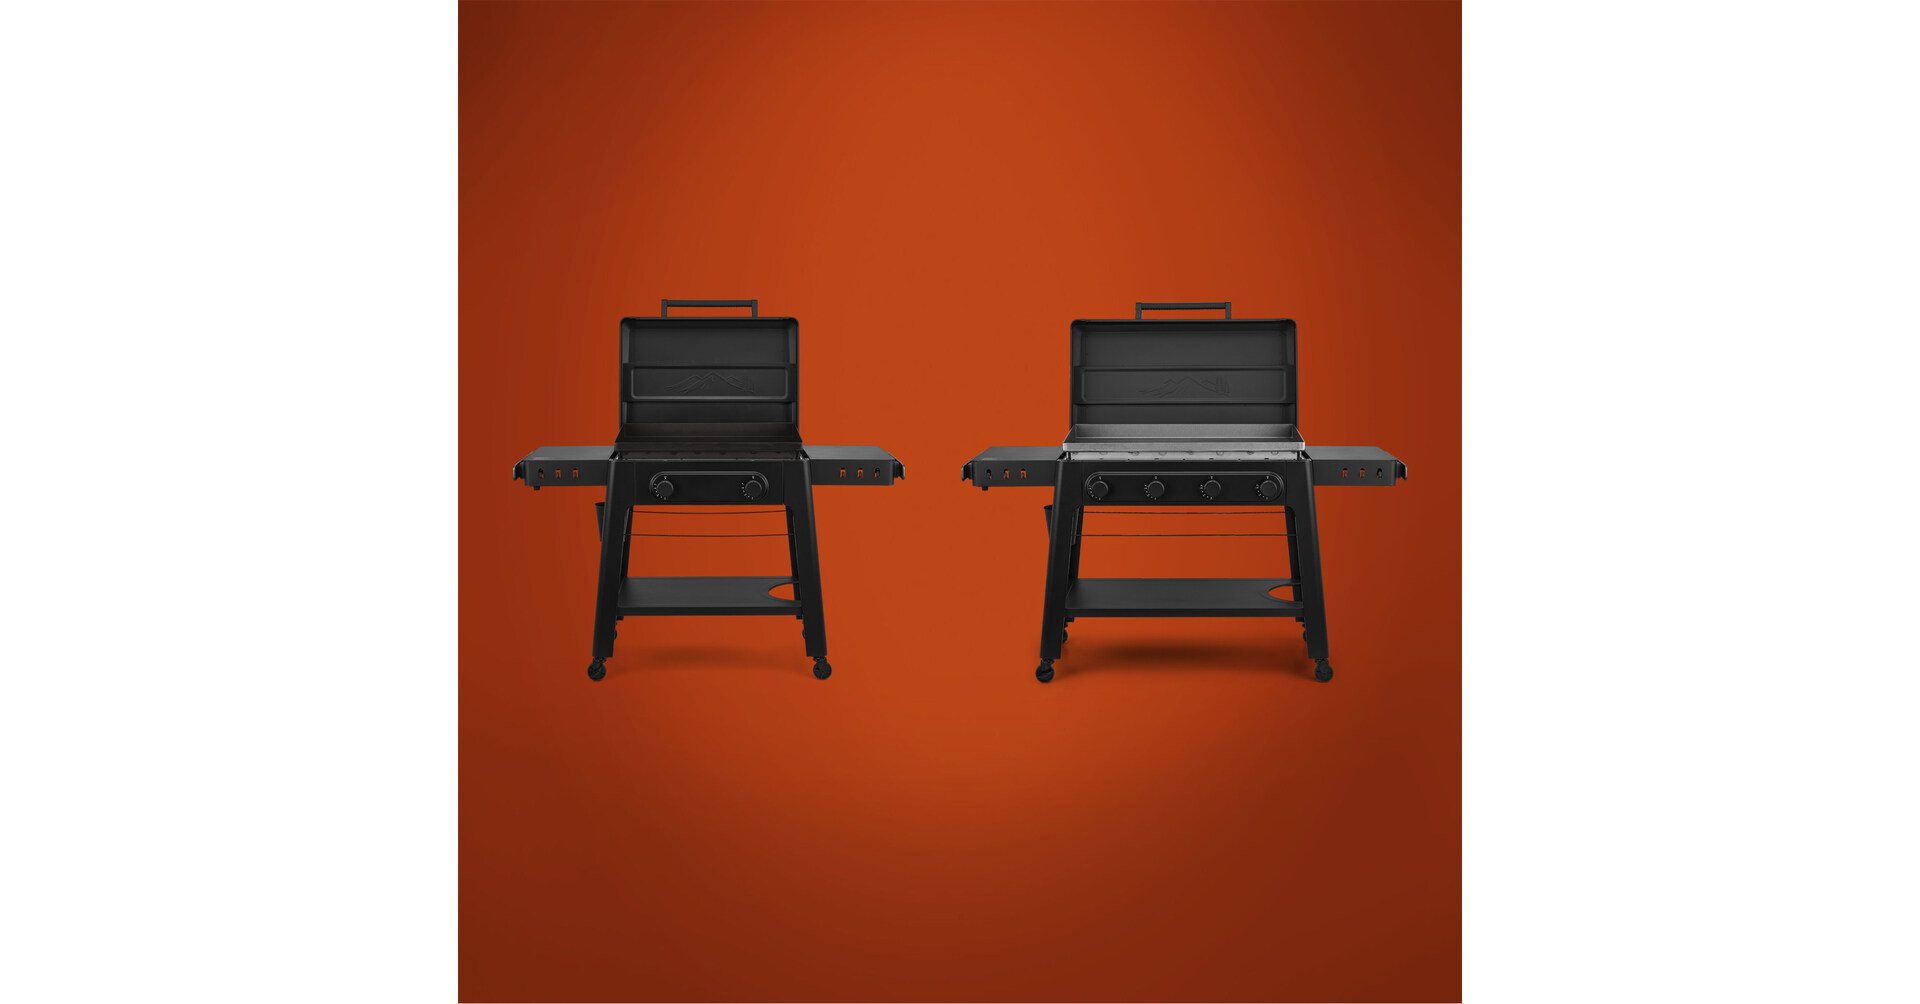
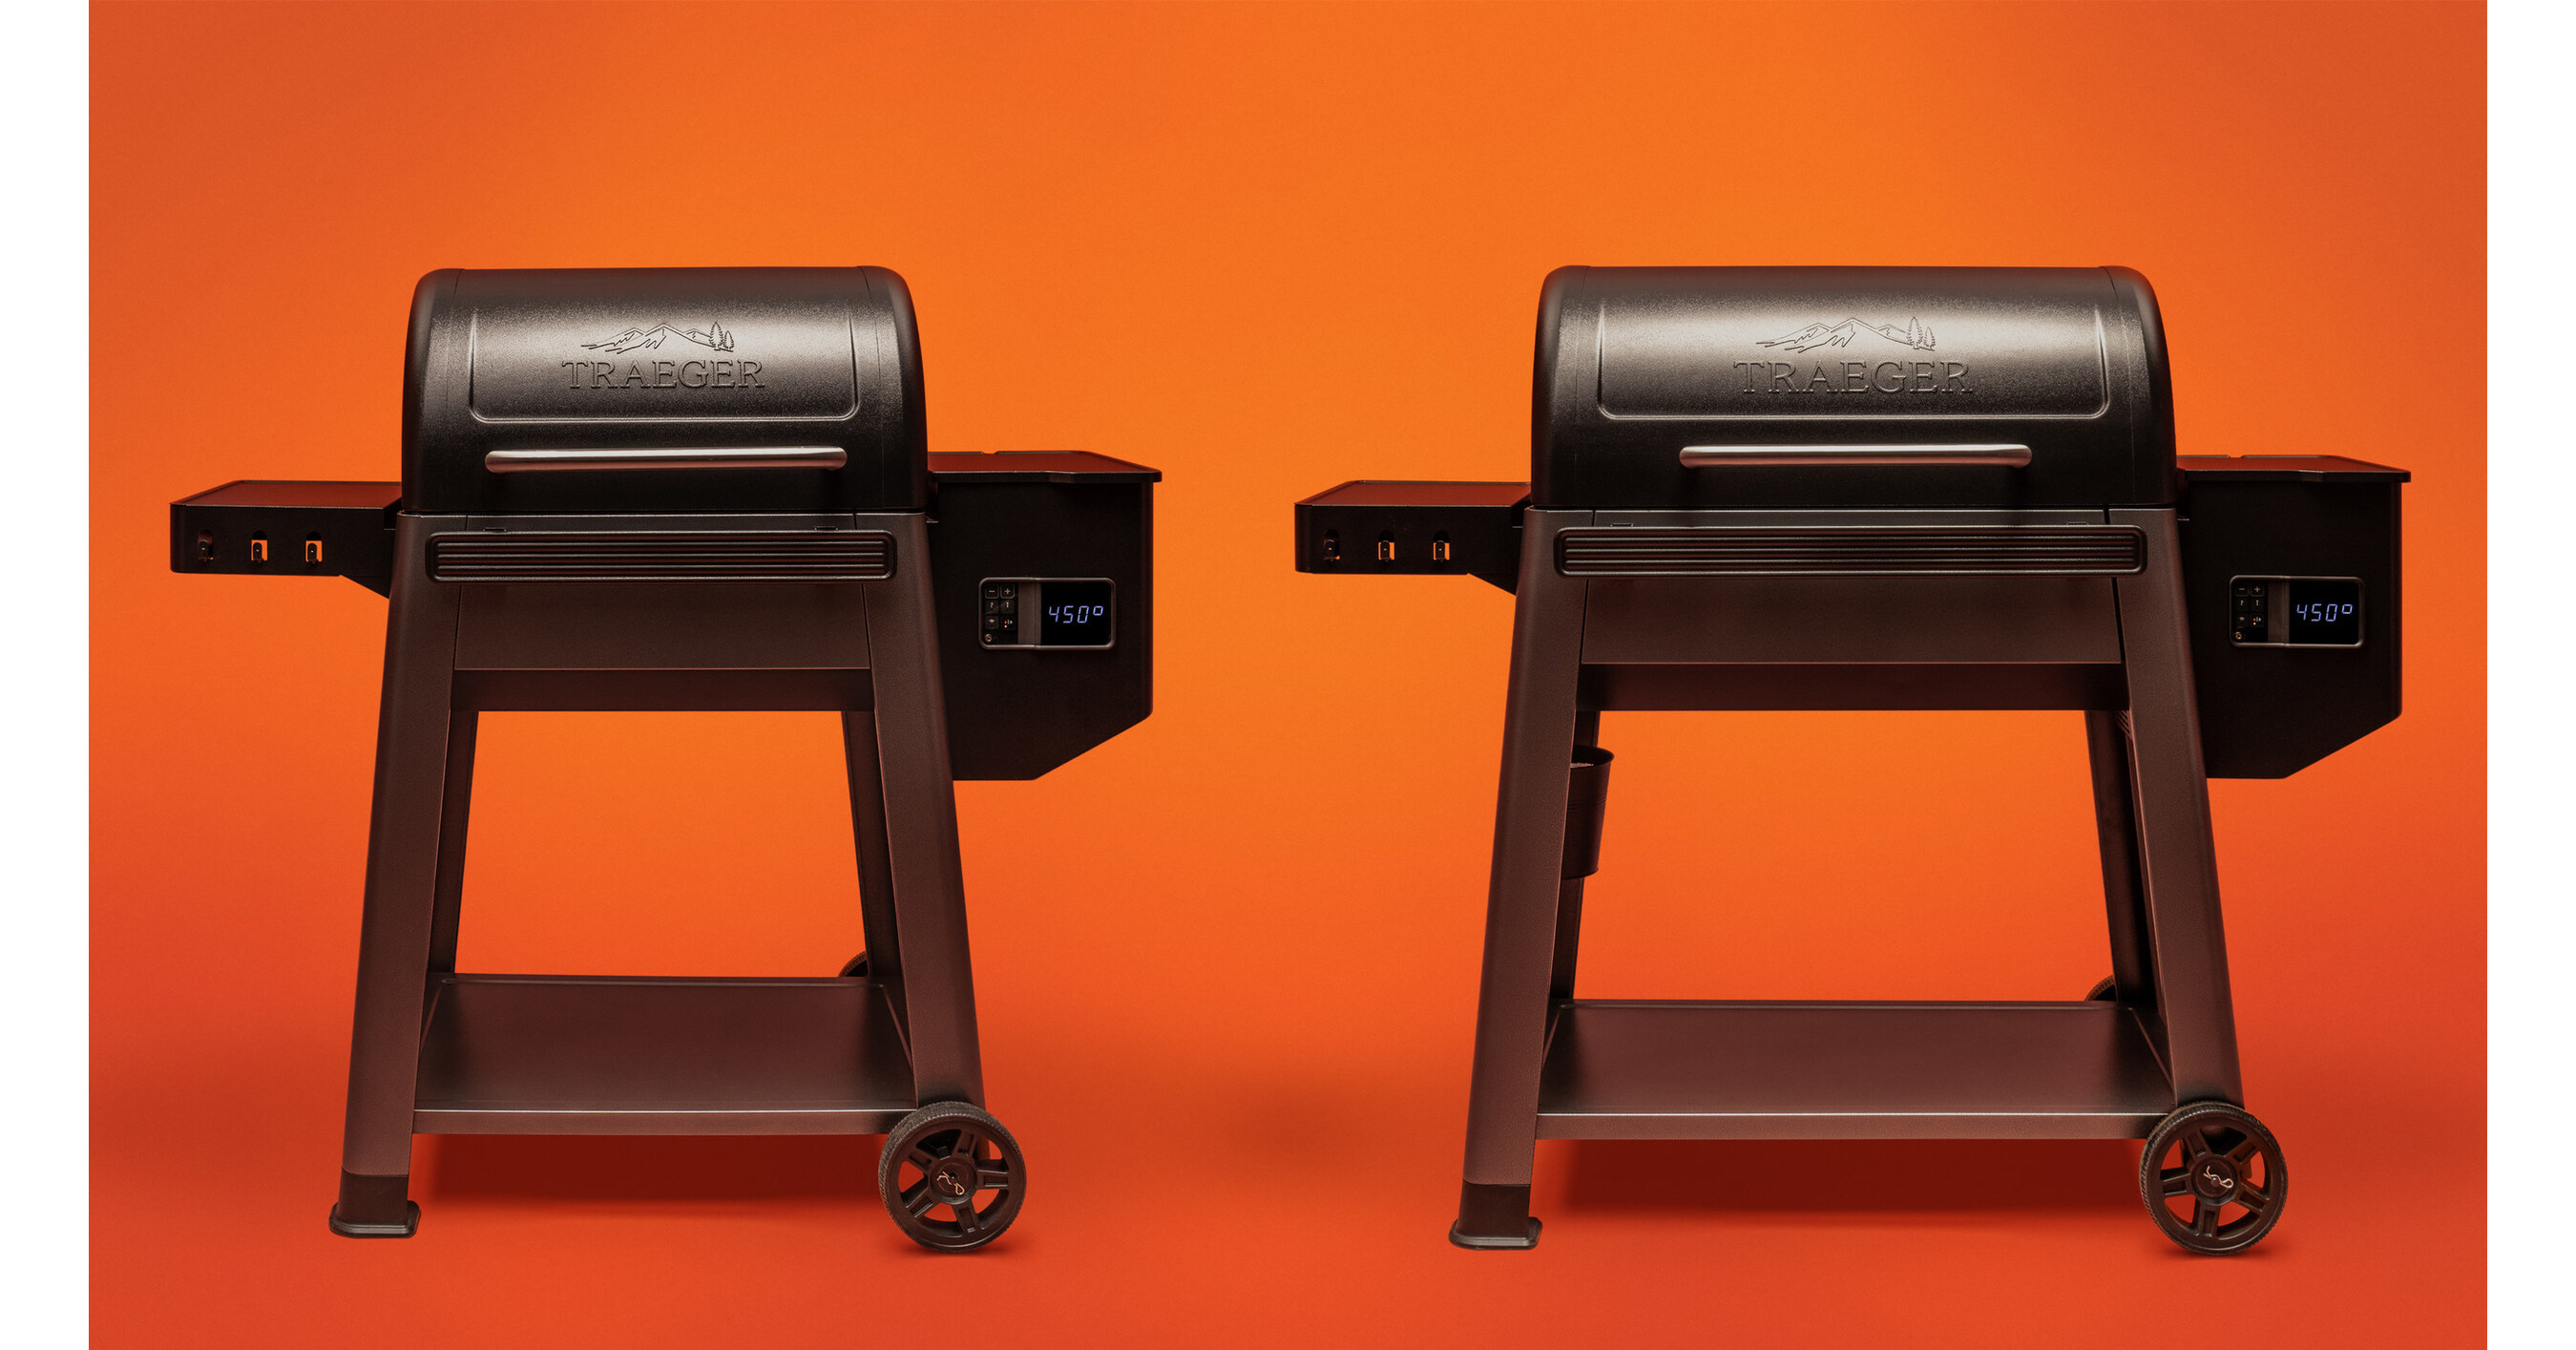
Traeger, Inc. designs, sources, sells, and supports wood pellet fueled barbecue grills and Flatrock flat top grills sold to retailers, distributors, and direct to consumers. The Company's integrated platform includes six types of products: wood pellet grills, gas griddles, grilling accessories, digital content, the Traeger app, and consumables. The Company offers eight primary grill lines: Woodridge Series, Timberline Series, Ironwood Series, Pro Series with WiFIRE, Pro Series without WiFIRE, Portable Series, Club Lineup, and Flatrock flat top grill. It offers a variety of Traeger-branded wood pellets, rubs and sauces. It offers a variety of grill accessories, tools to aid in meal prep, cooking, and cleanup, replacement parts, and apparel and merchandise. It produces a library of digital content including instructional recipes and videos that demonstrate tips, tricks, and cooking techniques. The Traeger app is a mobile software application available on iOS or Android devices.
Show More
Market Estimates
Earnings Estimates
Revenue
YoY Chg
EPS
YoYChg
FY2026Q1
FY2025Q4
FY2025Q3
143.96M
+0.47%
0.058
+15%
147.08M
-12.79%
0.023
+133.3%
110.66M
-9.33%
-0.040
-33.33%
Estimates Revision
The market is revising Downward the revenue expectations for Traeger, Inc. (COOK) for FY2025, with the revenue forecasts being adjusted by -7.78% over the past three months. During the same period, the stock price has changed by -5.30%.
Revenue Estimates for FY2025
Revise Downward

-7.78%
In Past 3 Month
EPS Estimates for FY2025
Revise Downward

-59.46%
In Past 3 Month
Stock Price
Go Down

-5.30%
In Past 3 Month
8 Analyst Rating
Wall Street analysts forecast COOK stock price to rise over the next 12 months. According to Wall Street analysts, the average 1-year price target for COOK is 1.75 USD with a low forecast of 1.25 USD and a high forecast of 3.00 USD. However, analyst price targets are subjective and often lag stock prices, so investors should focus on the objective reasons behind analyst rating changes, which better reflect the company's fundamentals.
1 Buy
7 Hold
0 Sell
Hold
Current: 1.250

Low
1.25
Averages
1.75
High
3.00
Current: 1.250

Low
1.25
Averages
1.75
High
3.00
B. Riley
B. Riley
Buy -> Neutral
downgrade
$3
2025-08-13
Reason
B. Riley
B. Riley
Price Target
$3
2025-08-13
downgrade
Buy -> Neutral
Reason
B. Riley downgraded Traeger to Neutral from Buy with a price target of $1.50, down from $3. The company's grill sales, which represent over 50% of its total revenue, re-inflected negatively in Q2 and the declines are expected to persist through at least Q4, the analyst tells investors in a research note. The firm says Traeger's price-takes benefits in response to tariffs is being more than offset by the resulting negative impact to volume. It believes the company needs to show a sustained sales recovery for the shares to break out beyond their multi-year $2-$3 average. Riley sees limited catalysts for a sales recovery in the next six months.
Telsey Advisory
Market Perform
downgrade
$2
2025-08-07
Reason
Telsey Advisory
Price Target
$2
2025-08-07
downgrade
Market Perform
Reason
Telsey Advisory lowered the firm's price target on Traeger to $1.75 from $2 and keeps a Market Perform rating on the shares. The company has yet to return to growth following the pandemic and the price increases needed to offset tariffs are putting the company at a disadvantage, the analyst tells investors.
Telsey Advisory Group
Joseph Feldman
Hold
Maintains
$2.5
2025-04-07
Reason
Telsey Advisory Group
Joseph Feldman
Price Target
$2.5
2025-04-07
Maintains
Hold
Reason
Telsey Advisory Group
Joseph Feldman
Buy
to
Hold
Downgrades
$4 → $2.5
2025-03-07
Reason
Telsey Advisory Group
Joseph Feldman
Price Target
$4 → $2.5
2025-03-07
Downgrades
Buy
to
Hold
Reason
Telsey Advisory downgraded Traeger to Market Perform from Outperform with a price target of $2.50, down from $4. The firm expects the company's performance trends to remain challenged in 2025. Traeger "provided soft, disappointing" 2025 guidance calling for flat sales at the midpoint, the analyst tells investors in a research note. Telsey says near-term consumer cautiousness in spending on discretionary, big-ticket items remains, given elevated interest rates and substantial accumulated inflation. Further, Traeger's guidance does not incorporate the impact of tariffs under the Trump administration, which could be "significantly negative" as 50% of its sales come from products sourced from China, adds the firm.
Canaccord Genuity
Brian McNamara
Strong Buy
Maintains
$7 → $5
2025-03-07
Reason
Canaccord Genuity
Brian McNamara
Price Target
$7 → $5
2025-03-07
Maintains
Strong Buy
Reason
Canaccord analyst Brian McNamara lowered the firm's price target on Traeger to $5 from $7 and keeps a Buy rating on the shares. The firm noted they reported strong Q4 results with sales above firm estimates and Street consensus. Grills were a standout performer once again, and Consumables also came in meaningfully above expectations, and management did not mention private label competition as a headwind this quarter.
Baird
Peter Benedict
Hold
Maintains
$3.5 → $2.5
2025-03-07
Reason
Baird
Peter Benedict
Price Target
$3.5 → $2.5
2025-03-07
Maintains
Hold
Reason
Baird analyst Peter Benedict lowered the firm's price target on Traeger to $2.50 from $3.50 and keeps a Neutral rating on the shares. The firm updated its model following Q4 results which was a good finish to the year but tariff fluidity clouds its outlook.
See All Ratings
Valuation Metrics
The current forward P/E ratio for Traeger Inc (COOK.N) is 23.90, compared to its 5-year average forward P/E of 5.91. For a more detailed relative valuation and DCF analysis to assess Traeger Inc 's fair value, click here.
Forward PE
The forward P/E ratio is a valuation metric that divides a company's current stock price by its estimated future earnings per share over the next 12 months.

N/A
5Y Average PE
5.91
Current PE
23.90
Overvalued PE
126.10
Undervalued PE
-114.29
Forward EV/EBITDA
The forward EV/EBITDA ratio is a valuation metric that divides a company's enterprise value (EV) by its estimated future earnings before interest, taxes, depreciation, and amortization (EBITDA) over the next 12 months.

Fair
5Y Average EV/EBITDA
16.11
Current EV/EBITDA
7.38
Overvalued EV/EBITDA
25.78
Undervalued EV/EBITDA
6.44
Forward PS
The forward P/S ratio is a valuation metric that divides a company's current stock price by its estimated future sales (or revenue) per share over the next 12 months.

Fair
5Y Average PS
0.90
Current PS
0.31
Overvalued PS
1.63
Undervalued PS
0.17
Financials
Annual
Quarterly
FY2025Q2
YoY :
-13.65%
145.48M
Total Revenue
FY2025Q2
YoY :
-154.79%
-2.63M
Operating Profit
FY2025Q2
YoY :
+186.42%
-7.38M
Net Income after Tax
FY2025Q2
YoY :
+200.00%
-0.06
EPS - Diluted
FY2025Q2
YoY :
+32.20%
15.51M
Free Cash Flow
FY2025Q2
YoY :
-12.15%
33.12
Gross Profit Margin - %
FY2025Q2
YoY :
-44.54%
1.88
FCF Margin - %
FY2025Q2
YoY :
+232.03%
-5.08
Net Margin - %
Trading Trends
Insider
Insiders are Neutral. There are no significant trading trends over the last month.
Sold
0-3
Months
0.0
USD
0
3-6
Months
0.0
USD
0
6-9
Months
0.0
USD
0
0-12
Months
0.0
USD
0
Bought
0-3
0
0.0
USD
Months
3-6
4
1.0M
USD
Months
6-9
0
0.0
USD
Months
0-12
0
0.0
USD
Months
Hedge Fund
Hedge Funds are Neutral. There are no significant trading trends over the last quarter.
Sold
0-3
Months
0.0
Volume
0
3-6
Months
15.0K
Volume
1
6-9
Months
0.0
Volume
0
0-12
Months
0.0
Volume
0
Bought
0-3
0
0.0
Volume
Months
3-6
0
0.0
Volume
Months
6-9
0
0.0
Volume
Months
0-12
0
0.0
Volume
Months
Congress Trading
Congress are Neutral. There are no significant trading trends over the last month.
Sold
0-3
Months
0.0
USD
0
3-6
Months
0.0
USD
0
6-9
Months
0.0
USD
0
0-12
Months
0.0
USD
0
Bought
0-3
0
0.0
USD
Months
3-6
0
0.0
USD
Months
6-9
0
0.0
USD
Months
0-12
0
0.0
USD
Months
Insider
Insiders are Neutral. There are no significant trading trends over the last month.
Sold
0-3
Months
0.0
USD
0
3-6
Months
0.0
USD
0
6-9
Months
0.0
USD
0
0-12
Months
0.0
USD
0
Bought
0-3
0
0.0
USD
Months
3-6
4
1.0M
USD
Months
6-9
0
0.0
USD
Months
0-12
0
0.0
USD
Months
COOK News & Events
Events Timeline
2025-08-06 (ET)
2025-08-06
17:28:38
Traeger sees FY25 revenue $540M-$555M, consensus $592.39M

2025-08-06
17:27:23
Traeger reports Q2 EPS (6c), consensus 6c

2025-05-01 (ET)
2025-05-01
16:25:03
Traeger withdraws guidance for FY25, implements cost savings initiatives

Sign Up For More Events
News
7.0
08-29TipRanksIs the White House Gold a Unique Home Depot (NYSE:HD) Case? Stock Prices Decline Amid Investigations
4.0
08-13BenzingaB. Riley Securities Downgrades Traeger to Neutral, Lowers Price Target to $1.5
4.0
07-31BenzingaTelsey Advisory Group Maintains Market Perform on Traeger, Maintains $2 Price Target
Sign Up For More News
People Also Watch

LWAY
Lifeway Foods Inc
30.830
USD
+3.56%

TRVI
Trevi Therapeutics Inc
7.150
USD
-1.65%

NMRA
Neumora Therapeutics Inc
1.750
USD
+0.57%

GIG
GigCapital7 Corp
0
USD
-0.10%

HCAT
Health Catalyst Inc
3.240
USD
-4.71%

BRT
BRT Apartments Corp
15.560
USD
+0.26%

MBX
MBX Biosciences Inc
14.400
USD
-1.17%

YSG
Yatsen Holding Ltd
9.300
USD
-3.53%

ABSI
Absci Corp
2.380
USD
+1.71%

CERS
Cerus Corp
1.310
USD
+3.15%
FAQ

What is Traeger Inc (COOK) stock price today?
The current price of COOK is 1.25 USD — it has increased 0 % in the last trading day.

What is Traeger Inc (COOK)'s business?

What is the price predicton of COOK Stock?

What is Traeger Inc (COOK)'s revenue for the last quarter?

What is Traeger Inc (COOK)'s earnings per share (EPS) for the last quarter?

What changes have occurred in the market's expectations for Traeger Inc (COOK)'s fundamentals?

How many employees does Traeger Inc (COOK). have?
