Walmart Replaces Eli Lilly in Russell 3000 Top 10
Written by Emily J. Thompson, Senior Investment Analyst
Updated: 51 minutes ago
0mins
Source: seekingalpha
- Market Capitalization Growth: As of April 30, 2026, the total market capitalization of the Russell 3000 Index surged 29% from $58.4 trillion last year to $75.6 trillion, indicating significant expansion in the US equity market that may attract more investor interest.
- Ranking Changes: Over the past year, Walmart replaced Eli Lilly as the only new entrant in the top ten of the Russell 3000 Index, while Nvidia surged to become the largest company with an 82.5% increase in market cap, reflecting strong performance in the tech sector.
- Tech Giants Performance: Alphabet's market cap soared by 141.9%, climbing from fifth to second place, showcasing its competitive strength in the market, while Apple and Microsoft dropped to third and fourth, indicating rapid shifts in market dynamics.
- Valuation Breakthrough: All ten largest companies in the Russell 3000 Index now exceed $1 trillion in market capitalization, with five surpassing $2 trillion and four exceeding $3 trillion, demonstrating increased market confidence in large enterprises and a significant rise in the number of companies valued over $1 trillion compared to 2025.
Trade with 70% Backtested Accuracy
Stop guessing "Should I Buy NVDA?" and start using high-conviction signals backed by rigorous historical data.
Sign up today to access powerful investing tools and make smarter, data-driven decisions.
Analyst Views on NVDA
Wall Street analysts forecast NVDA stock price to rise
41 Analyst Rating
39 Buy
1 Hold
1 Sell
Strong Buy
Current: 219.510

Low
200.00
Averages
264.97
High
352.00
Current: 219.510
Low
200.00
Averages
264.97
High
352.00
About NVDA
NVIDIA Corporation is an artificial intelligence (AI) infrastructure company. The Company is engaged in accelerated computing to help solve the challenging computational problems. Its segments include Compute & Networking and Graphics. The Compute & Networking segment includes its Data Center accelerated computing and networking platforms and AI solutions and software, and automotive platforms and autonomous and electric vehicle solutions, including software. The Graphics segment includes GeForce GPUs for gaming and personal computers (PCs), and Quadro/NVIDIA RTX GPUs for enterprise workstation graphics. Its technology stack includes the foundational NVIDIA CUDA development platform that runs on all NVIDIA GPUs, as well as hundreds of domain-specific software libraries, frameworks, algorithms, software development kits (SDKs), and application programming interfaces (APIs). Its platforms address four markets, which include Data Center, Gaming, Professional Visualization, and Automotive.
About the author

Emily J. Thompson
Emily J. Thompson, a Chartered Financial Analyst (CFA) with 12 years in investment research, graduated with honors from the Wharton School. Specializing in industrial and technology stocks, she provides in-depth analysis for Intellectia’s earnings and market brief reports.
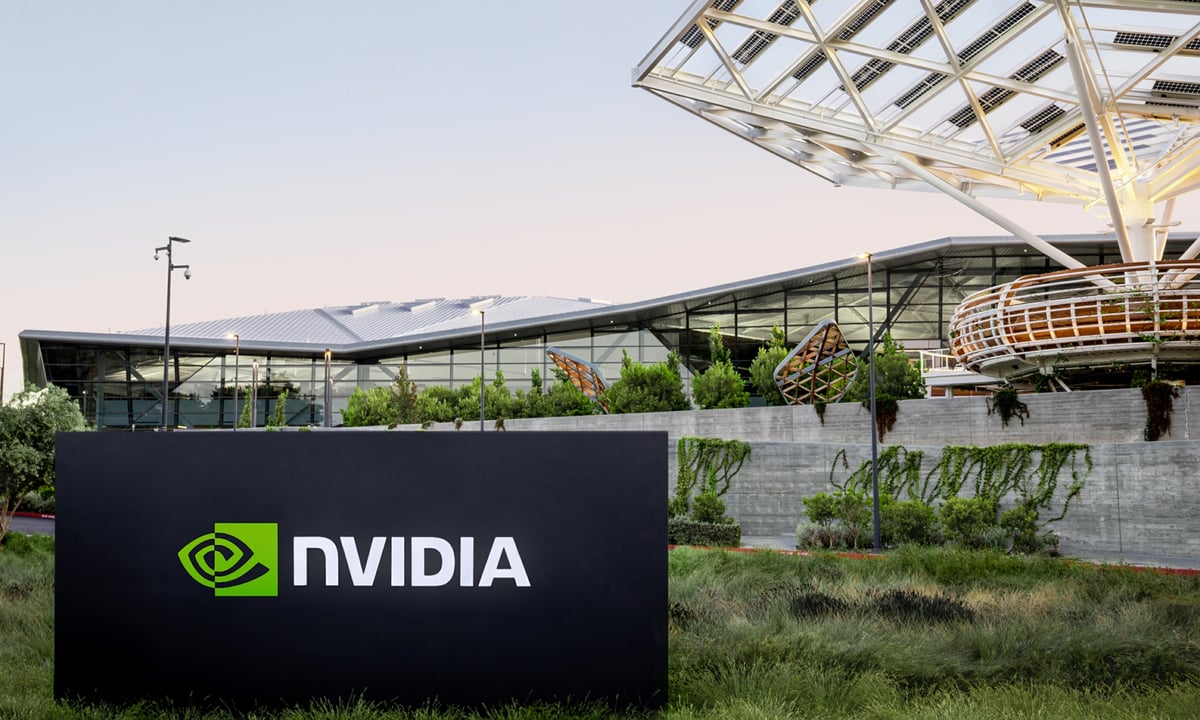
Nvidia Achieves $5 Trillion Market Capitalization

- Significant Revenue Growth: Nvidia reported $81.6 billion in revenue for Q1 fiscal 2027, marking an impressive 85% year-over-year increase, which surpasses last year's 69% growth rate, demonstrating strong demand and sustained market leadership in the AI chip sector.
- Profitability Surge: The company's non-GAAP earnings skyrocketed by 140% year-over-year to $1.87 per share, significantly exceeding last year's 33% growth, indicating Nvidia's ability to enhance profitability even in a highly competitive environment, thereby boosting investor confidence.
- Future Growth Expectations: Nvidia anticipates revenue of $91 billion for the current quarter, a remarkable 95% increase year-over-year, suggesting that the company is well-positioned to capitalize on the next phase of the AI computing cycle and expand its market share further.
- Infrastructure Spending Boom: AI infrastructure spending is projected to surge from $1 trillion in 2026 to between $3 trillion and $4 trillion by 2030, with Nvidia's data center revenue already at $75.2 billion, translating to an annual run rate of $300 billion, highlighting its substantial growth potential in this market.
See More

Analysis of Utility ETF Investment Strategies
- Utility ETF Overview: The Vanguard Utilities Index Fund ETF (VPU) offers broader mid and small-cap utility investment options at a 0.09% expense ratio for buy-and-hold income investors, having risen about 10% over the past year, indicating stable income potential.
- Liquidity Standard: The Utilities Select Sector SPDR Fund (XLU) is the default choice as it tracks the S&P 500 utilities sector, featuring 14% in NextEra Energy and about 7% in Southern and Duke Energy, with an expense ratio of 0.08% and a yield of approximately 2.6%, making it suitable for liquidity-focused investors.
- Low-Cost Option: The Fidelity MSCI Utilities Index ETF (FUTY) provides a low-cost option for Fidelity account holders with a 0.084% expense ratio and commission-free trading, also rising about 10% over the past year, though it has a smaller asset base and lower liquidity compared to the others.
- Investment Decision Tree: For investors prioritizing liquidity and institutional-quality execution, XLU is the standard; for long-term holders seeking broad utility exposure at the lowest cost, VPU is the pick, while FUTY is ideal for Fidelity clients looking for a permanent allocation.
See More

Walmart Replaces Eli Lilly in Russell 3000 Top 10

- Market Capitalization Growth: As of April 30, 2026, the total market capitalization of the Russell 3000 Index surged 29% from $58.4 trillion last year to $75.6 trillion, indicating significant expansion in the US equity market that may attract more investor interest.
- Ranking Changes: Over the past year, Walmart replaced Eli Lilly as the only new entrant in the top ten of the Russell 3000 Index, while Nvidia surged to become the largest company with an 82.5% increase in market cap, reflecting strong performance in the tech sector.
- Tech Giants Performance: Alphabet's market cap soared by 141.9%, climbing from fifth to second place, showcasing its competitive strength in the market, while Apple and Microsoft dropped to third and fourth, indicating rapid shifts in market dynamics.
- Valuation Breakthrough: All ten largest companies in the Russell 3000 Index now exceed $1 trillion in market capitalization, with five surpassing $2 trillion and four exceeding $3 trillion, demonstrating increased market confidence in large enterprises and a significant rise in the number of companies valued over $1 trillion compared to 2025.
See More

Walmart and Costco's Recession-Proof Advantages


- Operational Efficiency Analysis: Walmart and Costco have operating margins of 4.2% and 3.8%, respectively, and despite these low margins, both companies maintain stable growth by leveraging massive sales volumes and efficient supply chains to deliver customer value amid economic pressures.
- Private Label Competitiveness: Walmart's Great Value and Costco's Kirkland Signature private labels undercut name brands on price, catering to consumers' demand for value during economic downturns, thereby further solidifying their market share.
- E-commerce and Service Expansion: Walmart is rapidly expanding its e-commerce through Walmart+ while offering services like fuel, auto care, and pharmacy, enhancing customer loyalty and driving revenue growth despite challenges in the overall retail market.
- Valuation and Investment Recommendation: With Walmart's and Costco's P/E ratios at 44.4 and 54.6, indicating high valuations, Walmart's advantages in AI application and dividend growth make it a more attractive investment choice, especially in the current market environment.
See More

Analysis of Walmart and Costco's Market Performance
- Declining Dividend Yields: Both Walmart and Costco have dividend yields below 1%, indicating that while they perform steadily in the market, investors may face insufficient returns amid an economic slowdown, which could deter risk-averse investors.
- Low Operating Margins: With operating margins of 4.2% for Walmart and 3.8% for Costco, both companies convert only about $0.04 of every sales dollar into operating income; however, they offset this with massive sales volumes and efficient supply chains, maintaining competitive advantages.
- High Valuation Risks: Walmart's price-to-earnings ratio stands at 44.4, while Costco's is even higher at 54.6, suggesting that the market has fully recognized their competitive advantages, yet such high valuations may expose investors to significant risks in the current market environment.
- AI Technology Adoption: Walmart is actively leveraging artificial intelligence across its operations and customer experience, which is expected to enhance its operational efficiency and market competitiveness, while Costco continues to focus on brand value and customer loyalty, despite both companies appearing overpriced in the stock market.
See More

Huawei Unveils New Semiconductor Technology Amid Sanctions


- Technological Breakthrough: Huawei announced the development of a new engineering method called 'Logic Folding' aimed for its Kirin smartphone chips in fall 2026, which will help maintain competitiveness in the global semiconductor market despite U.S. sanctions.
- Market Share Recovery: The launch of Huawei's Mate 60 smartphone in 2023, featuring advanced 5G connectivity, has successfully regained market share from Apple, demonstrating strong recovery capabilities in the Chinese market.
- Future Development Goals: Huawei anticipates that by 2031, its new chip technology could achieve capabilities equivalent to 1.4-nanometer processes, although industry experts express skepticism regarding the feasibility of this target, citing unresolved manufacturing challenges.
- Pursuit of Academic Recognition: Over the past six years, Huawei has designed and mass-produced 381 chips based on the 'τ Scaling Law', aiming to enhance semiconductor technology through new system optimization principles, despite ongoing challenges in heat management and large-scale manufacturing.
See More
Nvidia Achieves $5 Trillion Market Capitalization
- Significant Revenue Growth: Nvidia reported $81.6 billion in revenue for Q1 fiscal 2027, marking an impressive 85% year-over-year increase, which surpasses last year's 69% growth rate, demonstrating strong demand and sustained market leadership in the AI chip sector.
- Profitability Surge: The company's non-GAAP earnings skyrocketed by 140% year-over-year to $1.87 per share, significantly exceeding last year's 33% growth, indicating Nvidia's ability to enhance profitability even in a highly competitive environment, thereby boosting investor confidence.
- Future Growth Expectations: Nvidia anticipates revenue of $91 billion for the current quarter, a remarkable 95% increase year-over-year, suggesting that the company is well-positioned to capitalize on the next phase of the AI computing cycle and expand its market share further.
- Infrastructure Spending Boom: AI infrastructure spending is projected to surge from $1 trillion in 2026 to between $3 trillion and $4 trillion by 2030, with Nvidia's data center revenue already at $75.2 billion, translating to an annual run rate of $300 billion, highlighting its substantial growth potential in this market.
See More
Analysis of Utility ETF Investment Strategies
- Utility ETF Overview: The Vanguard Utilities Index Fund ETF (VPU) offers broader mid and small-cap utility investment options at a 0.09% expense ratio for buy-and-hold income investors, having risen about 10% over the past year, indicating stable income potential.
- Liquidity Standard: The Utilities Select Sector SPDR Fund (XLU) is the default choice as it tracks the S&P 500 utilities sector, featuring 14% in NextEra Energy and about 7% in Southern and Duke Energy, with an expense ratio of 0.08% and a yield of approximately 2.6%, making it suitable for liquidity-focused investors.
- Low-Cost Option: The Fidelity MSCI Utilities Index ETF (FUTY) provides a low-cost option for Fidelity account holders with a 0.084% expense ratio and commission-free trading, also rising about 10% over the past year, though it has a smaller asset base and lower liquidity compared to the others.
- Investment Decision Tree: For investors prioritizing liquidity and institutional-quality execution, XLU is the standard; for long-term holders seeking broad utility exposure at the lowest cost, VPU is the pick, while FUTY is ideal for Fidelity clients looking for a permanent allocation.
See More
Walmart Replaces Eli Lilly in Russell 3000 Top 10
- Market Capitalization Growth: As of April 30, 2026, the total market capitalization of the Russell 3000 Index surged 29% from $58.4 trillion last year to $75.6 trillion, indicating significant expansion in the US equity market that may attract more investor interest.
- Ranking Changes: Over the past year, Walmart replaced Eli Lilly as the only new entrant in the top ten of the Russell 3000 Index, while Nvidia surged to become the largest company with an 82.5% increase in market cap, reflecting strong performance in the tech sector.
- Tech Giants Performance: Alphabet's market cap soared by 141.9%, climbing from fifth to second place, showcasing its competitive strength in the market, while Apple and Microsoft dropped to third and fourth, indicating rapid shifts in market dynamics.
- Valuation Breakthrough: All ten largest companies in the Russell 3000 Index now exceed $1 trillion in market capitalization, with five surpassing $2 trillion and four exceeding $3 trillion, demonstrating increased market confidence in large enterprises and a significant rise in the number of companies valued over $1 trillion compared to 2025.
See More
Walmart and Costco's Recession-Proof Advantages
- Operational Efficiency Analysis: Walmart and Costco have operating margins of 4.2% and 3.8%, respectively, and despite these low margins, both companies maintain stable growth by leveraging massive sales volumes and efficient supply chains to deliver customer value amid economic pressures.
- Private Label Competitiveness: Walmart's Great Value and Costco's Kirkland Signature private labels undercut name brands on price, catering to consumers' demand for value during economic downturns, thereby further solidifying their market share.
- E-commerce and Service Expansion: Walmart is rapidly expanding its e-commerce through Walmart+ while offering services like fuel, auto care, and pharmacy, enhancing customer loyalty and driving revenue growth despite challenges in the overall retail market.
- Valuation and Investment Recommendation: With Walmart's and Costco's P/E ratios at 44.4 and 54.6, indicating high valuations, Walmart's advantages in AI application and dividend growth make it a more attractive investment choice, especially in the current market environment.
See More
Analysis of Walmart and Costco's Market Performance
- Declining Dividend Yields: Both Walmart and Costco have dividend yields below 1%, indicating that while they perform steadily in the market, investors may face insufficient returns amid an economic slowdown, which could deter risk-averse investors.
- Low Operating Margins: With operating margins of 4.2% for Walmart and 3.8% for Costco, both companies convert only about $0.04 of every sales dollar into operating income; however, they offset this with massive sales volumes and efficient supply chains, maintaining competitive advantages.
- High Valuation Risks: Walmart's price-to-earnings ratio stands at 44.4, while Costco's is even higher at 54.6, suggesting that the market has fully recognized their competitive advantages, yet such high valuations may expose investors to significant risks in the current market environment.
- AI Technology Adoption: Walmart is actively leveraging artificial intelligence across its operations and customer experience, which is expected to enhance its operational efficiency and market competitiveness, while Costco continues to focus on brand value and customer loyalty, despite both companies appearing overpriced in the stock market.
See More
Huawei Unveils New Semiconductor Technology Amid Sanctions
- Technological Breakthrough: Huawei announced the development of a new engineering method called 'Logic Folding' aimed for its Kirin smartphone chips in fall 2026, which will help maintain competitiveness in the global semiconductor market despite U.S. sanctions.
- Market Share Recovery: The launch of Huawei's Mate 60 smartphone in 2023, featuring advanced 5G connectivity, has successfully regained market share from Apple, demonstrating strong recovery capabilities in the Chinese market.
- Future Development Goals: Huawei anticipates that by 2031, its new chip technology could achieve capabilities equivalent to 1.4-nanometer processes, although industry experts express skepticism regarding the feasibility of this target, citing unresolved manufacturing challenges.
- Pursuit of Academic Recognition: Over the past six years, Huawei has designed and mass-produced 381 chips based on the 'τ Scaling Law', aiming to enhance semiconductor technology through new system optimization principles, despite ongoing challenges in heat management and large-scale manufacturing.
See More