Bitcoin Price Influenced by Geopolitical Tensions

- Bitcoin Support Level: Bitcoin has formed a support level above $66,000 as investor optimism for a ceasefire with Iran grows, despite the ongoing closure of the Strait of Hormuz, indicating market sensitivity to geopolitical developments.
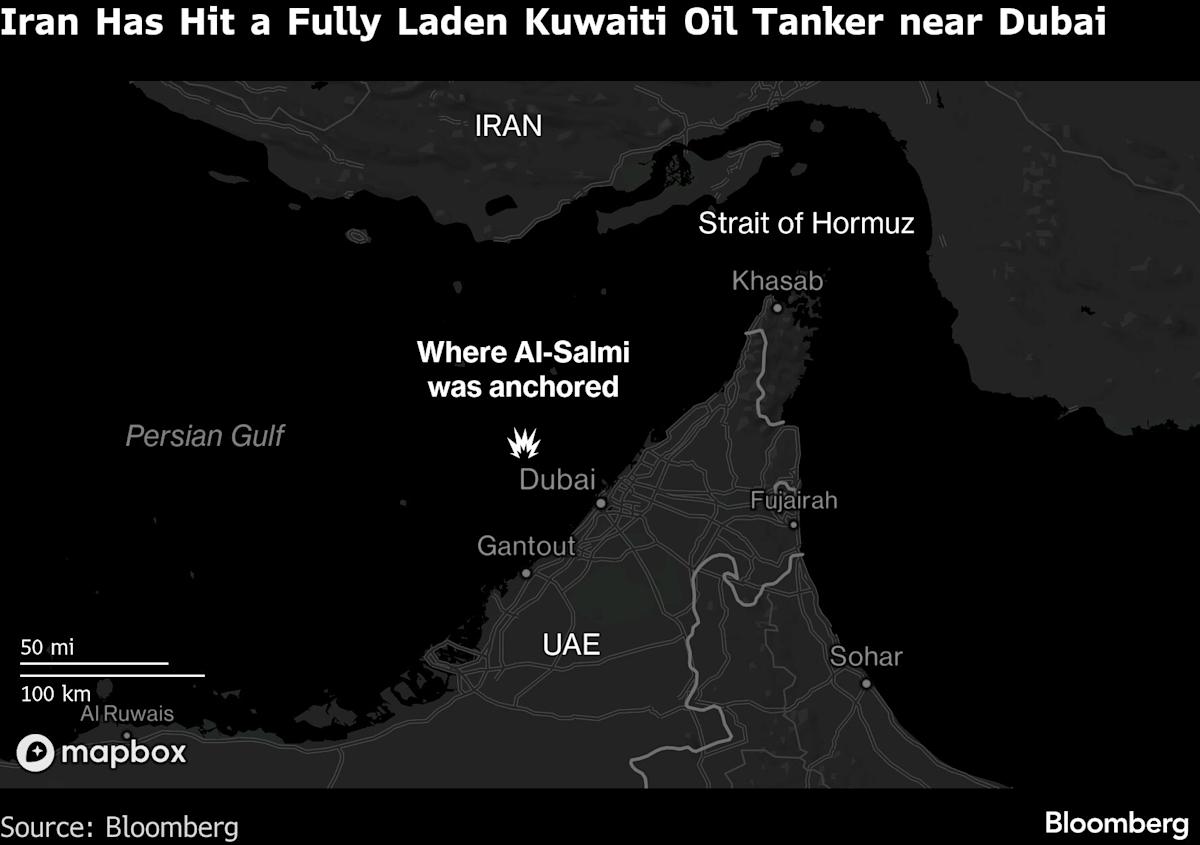
- Surging Oil Prices: Crude oil prices have surged above $100 due to Iran's blockade of the Strait of Hormuz, raising concerns about the economic outlook and negatively impacting risk assets like Bitcoin.
- Market Volatility: Bitcoin briefly rose above $68,000 but fell back to $66,387, reflecting mixed market reactions to Trump's diplomatic efforts and cautious investor sentiment regarding future price movements.
- Macro Economic Focus: Investors are closely watching the upcoming non-farm payroll data, which could influence market sentiment and determine whether Bitcoin can break through the critical psychological level of $70,000.
Get Real-Time Alerts for Any Crypto Movement
Technical Analysis for BTC
Technical Sentiment Analysis for Bitcoin (BTC). As of , Bitcoin (BTC) is exhibiting a Neutral technical sentiment. Our proprietary analysis, which aggregates 6 technical signals, shows that 3 indicators are flashing buy, while 3 are indicating sell.
Momentum Indicators: RSI, MACD & Overbought/Oversold Status. Currently, the Relative Strength Index (RSI) for BTC stands at -, which suggests a Neutral condition. Meanwhile, the MACD (12, 26) indicator is at -, providing a Neutral signal for short-term momentum. Other oscillators like the Stochastic Oscillator at - and the Commodity Channel Index (CCI) at - further confirm a - outlook for the crypto.
Support, Resistance & Moving Averages. From a structural perspective, BTC is trading below its 60-day moving average of $- and below its 200-day long-term moving average of $-. Key price levels to watch include the immediate resistance at $- and strong support at $-. A break above $- could signal a bull continuation, while falling below $- may test the next Fibonacci floor at $-.
Bitcoin (BTC) Support & Resistance Level
| Name | S3 | S2 | S1 | Pivot Points | R1 | R2 | R3 |
|---|---|---|---|---|---|---|---|
| Classic | 57779.274 | 61389.637 | 64805.364 | 68415.727 | 71831.454 | 75441.817 | 78857.544 |
| Fibonacci | 61389.637 | 64073.603 | 65731.761 | 68415.727 | 71099.693 | 72757.851 | 75441.817 |
About BTC
About the author