UGRO Overview
-
$
0.000
0.000(0.000%)
At close0.000(0.000%)Aft-market
ET
Loading chart...

The current price of UGRO is 0 USD — it has increased 10.48
Flash Sports & Media Holdings, Inc., formerly urban-gro, Inc., is a global sport, media, and experiential platform. The Company is focused on the creation, production, commercialization, and monetization of live events, sports properties, original content, media rights, sponsorships, and branded fan experiences. The Company operates across multiple sports and entertainment verticals, combining proprietary intellectual property, strategic partnerships, and experiential activations to engage global audiences and deliver measurable value for brands, sponsors, and media partners. It owns the content and controls the distribution, a combination few in cricket media hold, capturing the full value chain that licensing-led players give away. Its anchor asset is the commercial and media rights to the Lanka Premier League, with Star Sports as broadcaster and Innovative Production Group FZ, LLC (IPG) integrated as Flash's in-house rights, league-management, and production engine.
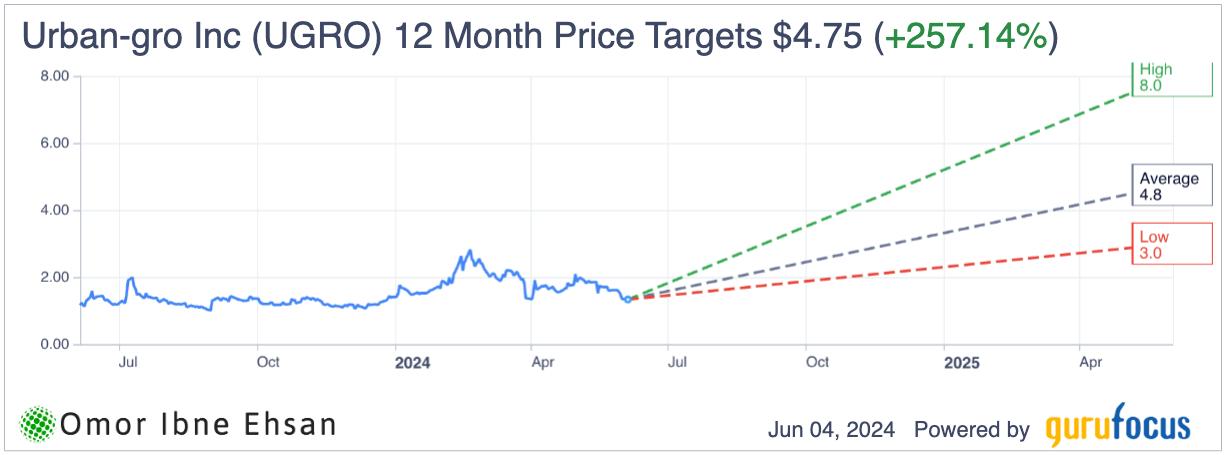
Wall Street analysts forecast UGRO stock price to fall over the next 12 months. According to Wall Street analysts, the average 1-year price target for UGRO is USD with a low forecast of USD and a high forecast of USD. However, analyst price targets are subjective and often lag stock prices, so investors should focus on the objective reasons behind analyst rating changes, which better reflect the company's fundamentals.
urban-gro Inc revenue for the last quarter amounts to 484.24K USD, decreased -81.95
urban-gro Inc. EPS for the last quarter amounts to -13.01 USD, decreased -76.14
urban-gro Inc (UGRO) has 110 emplpoyees as of July 10 2026.
Today UGRO has the market capitalization of 16.14M USD.