Intellectia LogoIntellectia
Product
Resources
Markets
News
Partner Program
Pricing
Log inTry for Free
Intellectia Logo
Log in
Intellectia Logo

Product

Features
Financial AI Agent
Stock Technical Analysis
Stock Monitor
Hedge Fund Tracker
AI Screener
Trading Strategies
AI Stock Picker
Swing Trading
Quant AI
Stock Chart Patterns
Daytrading Center
AI Earnings Prediction
Whales Auto Tracker
Backtesting Playground

Resources

Learn
Blog
Earnings
Tutorial
Help Center
Company
About Us
Contact
Press
Reward Program
Partner Program
Tools
Dividend Calculator
Dividend Yield Calculator
Options Profit Calculator
Compare
TradingView
SeekingAlpha

Markets

Trending Stocks
Hot Crypto
Trending News
All Stocks

News

Trading News
Overview
Top News
Daily Market Brief
Earnings
Latest
Newswire
Stock News
Crypto News
Monitor News
Partner ProgramPricing
Start for Free
  1. Home
  2. >
  3. Stock
  4. >
  5. QVCGA
stocks logo

QVCGA

-
collectAdd to Watchlistadvanced chartAdvanced Chart
$
0.000
0(0.000%)1D
collectadvanced chart
    Overview
    Forecast
    Valuation
    Earnings
High
--
Open
--
VWAP
--
Vol
--
Mkt Cap
--
Low
--
Amount
--
EV/EBITDA(TTM)
--
Total Shares
--
EV
--
EV/OCF(TTM)
--
P/S(TTM)
--
Intellectia AI SwingMax

Valuation Metrics

The current forward P/E ratio for QVC Group Inc (QVCGA.O) is , compared to its 5-year average forward P/E of . For a more detailed relative valuation and DCF analysis to assess QVC Group Inc 's fair value, click here.
  • Forward PE
  • Forward EV/EBITDA
  • Forward PS

Forward PE

The forward P/E ratio is a valuation metric that divides a company's current stock price by its estimated future earnings per share over the next 12 months.
StronglyUndervaluedUndervaluedFairOvervaluedStronglyOvervalueddotted line Image
Fair
5Y Average PE
Current PE
NaN
Overvalued PE
Undervalued PE

Forward EV/EBITDA

The forward EV/EBITDA ratio is a valuation metric that divides a company's enterprise value (EV) by its estimated future earnings before interest, taxes, depreciation, and amortization (EBITDA) over the next 12 months.
StronglyUndervaluedUndervaluedFairOvervaluedStronglyOvervalueddotted line Image
Fair
5Y Average EV/EBITDA
Current EV/EBITDA
NaN
Overvalued EV/EBITDA
Undervalued EV/EBITDA

Forward PS

The forward P/S ratio is a valuation metric that divides a company's current stock price by its estimated future sales (or revenue) per share over the next 12 months.
StronglyUndervaluedUndervaluedFairOvervaluedStronglyOvervalueddotted line Image
Fair
5Y Average PS
Current PS
NaN
Overvalued PS
Undervalued PS
Financial AI Agent
Financial AI Agent

Financials

Annual
Quarterly
N/A
Total Revenue
N/A
Operating Profit
N/A
Net Income after Tax
N/A
EPS - Diluted
N/A
Free Cash Flow
N/A
Gross Profit Margin - %
N/A
FCF Margin - %
N/A
Net Margin - %
N/A
ROIC

Trading Trends

  • Insider
  • Hedge Fund
  • Congress Trading
Insider
Insiders are Neutral. There are no significant trading trends over the last month.
Sold
Bought
Hedge Fund
Hedge Funds are Neutral. There are no significant trading trends over the last quarter.
Sold
Bought
Congress Trading
Congress are Neutral. There are no significant trading trends over the last month.
Sold
Bought
Insider
Insiders are Neutral. There are no significant trading trends over the last month.
Sold
Bought
AI Stock Picker
AI Stock Picker

QVCGA News & Events

Events Timeline

Sign Up For More Events
no data image
No Data
Sign Up For More Events

News

[object Object]
Preview
8.0
11-18PRnewswire
QVC Group Announces Semi-Annual Interest Payment and Regular Additional Distribution on 4.0% Senior Exchangeable Debentures Due 2029
  • Interest Payment Announcement: QVC Group, Inc. announced a semi-annual interest payment of $20.00 per $1,000 original principal amount of its 4.0% Senior Exchangeable Debentures, along with a Regular Additional Distribution of $0.5824 per Debenture, both payable on November 17, 2025.

  • Principal Adjustments: The principal amount of the Debentures is adjusted based on Extraordinary Additional Distributions, with the most recent adjustment stemming from a past merger transaction, but this does not affect the semi-annual interest payments, which remain at 4.0% of the original principal amount.

[object Object]
Preview
1.0
11-18Newsfilter
QVC Kicks Off the Holiday Season with Mrs. Claus' Holiday House Starring Kathy Hilton
  • QVC's Holiday Pop-Up: QVC is launching Mrs. Claus' Holiday House, a two-day pop-up event in New York City on November 19-20, featuring interactive experiences, celebrity guests, and exclusive holiday products.

  • Celebrity Involvement: Kathy Hilton, as QVC's Mrs. Claus, will host the event alongside other QVC personalities, offering festive inspiration and special-edition gifts to attendees.

  • Live Streaming Experience: For those unable to attend in person, QVC will broadcast a TikTok Shop Live Super Brand Day on November 19, showcasing celebrity appearances, exclusive deals, and behind-the-scenes content from the Holiday House.

  • Event Details: The Holiday House will be open to the public at Iron23 in New York City, with specific hours for each day, and aims to create a joyful and inspiring shopping experience for the holiday season.

[object Object]
Preview
9.5
11-05SeekingAlpha
QVC Group announces third-quarter financial results
  • Q3 Financial Performance: QVC Group reported a net loss of $80 million for Q3, with revenue declining by 5.6% year-over-year to $2.21 billion.

  • Future Outlook: The company anticipates that social and streaming revenue will approach double digits for QxH, while maintaining a focus on cost discipline and capital structure adjustments.

Sign Up For More News

People Also Watch

FAQ

arrow icon

What is QVC Group Inc (QVCGA) stock price today?

The current price of QVCGA is 9.36 USD — it has increased 3.08 % in the last trading day.

arrow icon

What is QVC Group Inc (QVCGA)'s business?

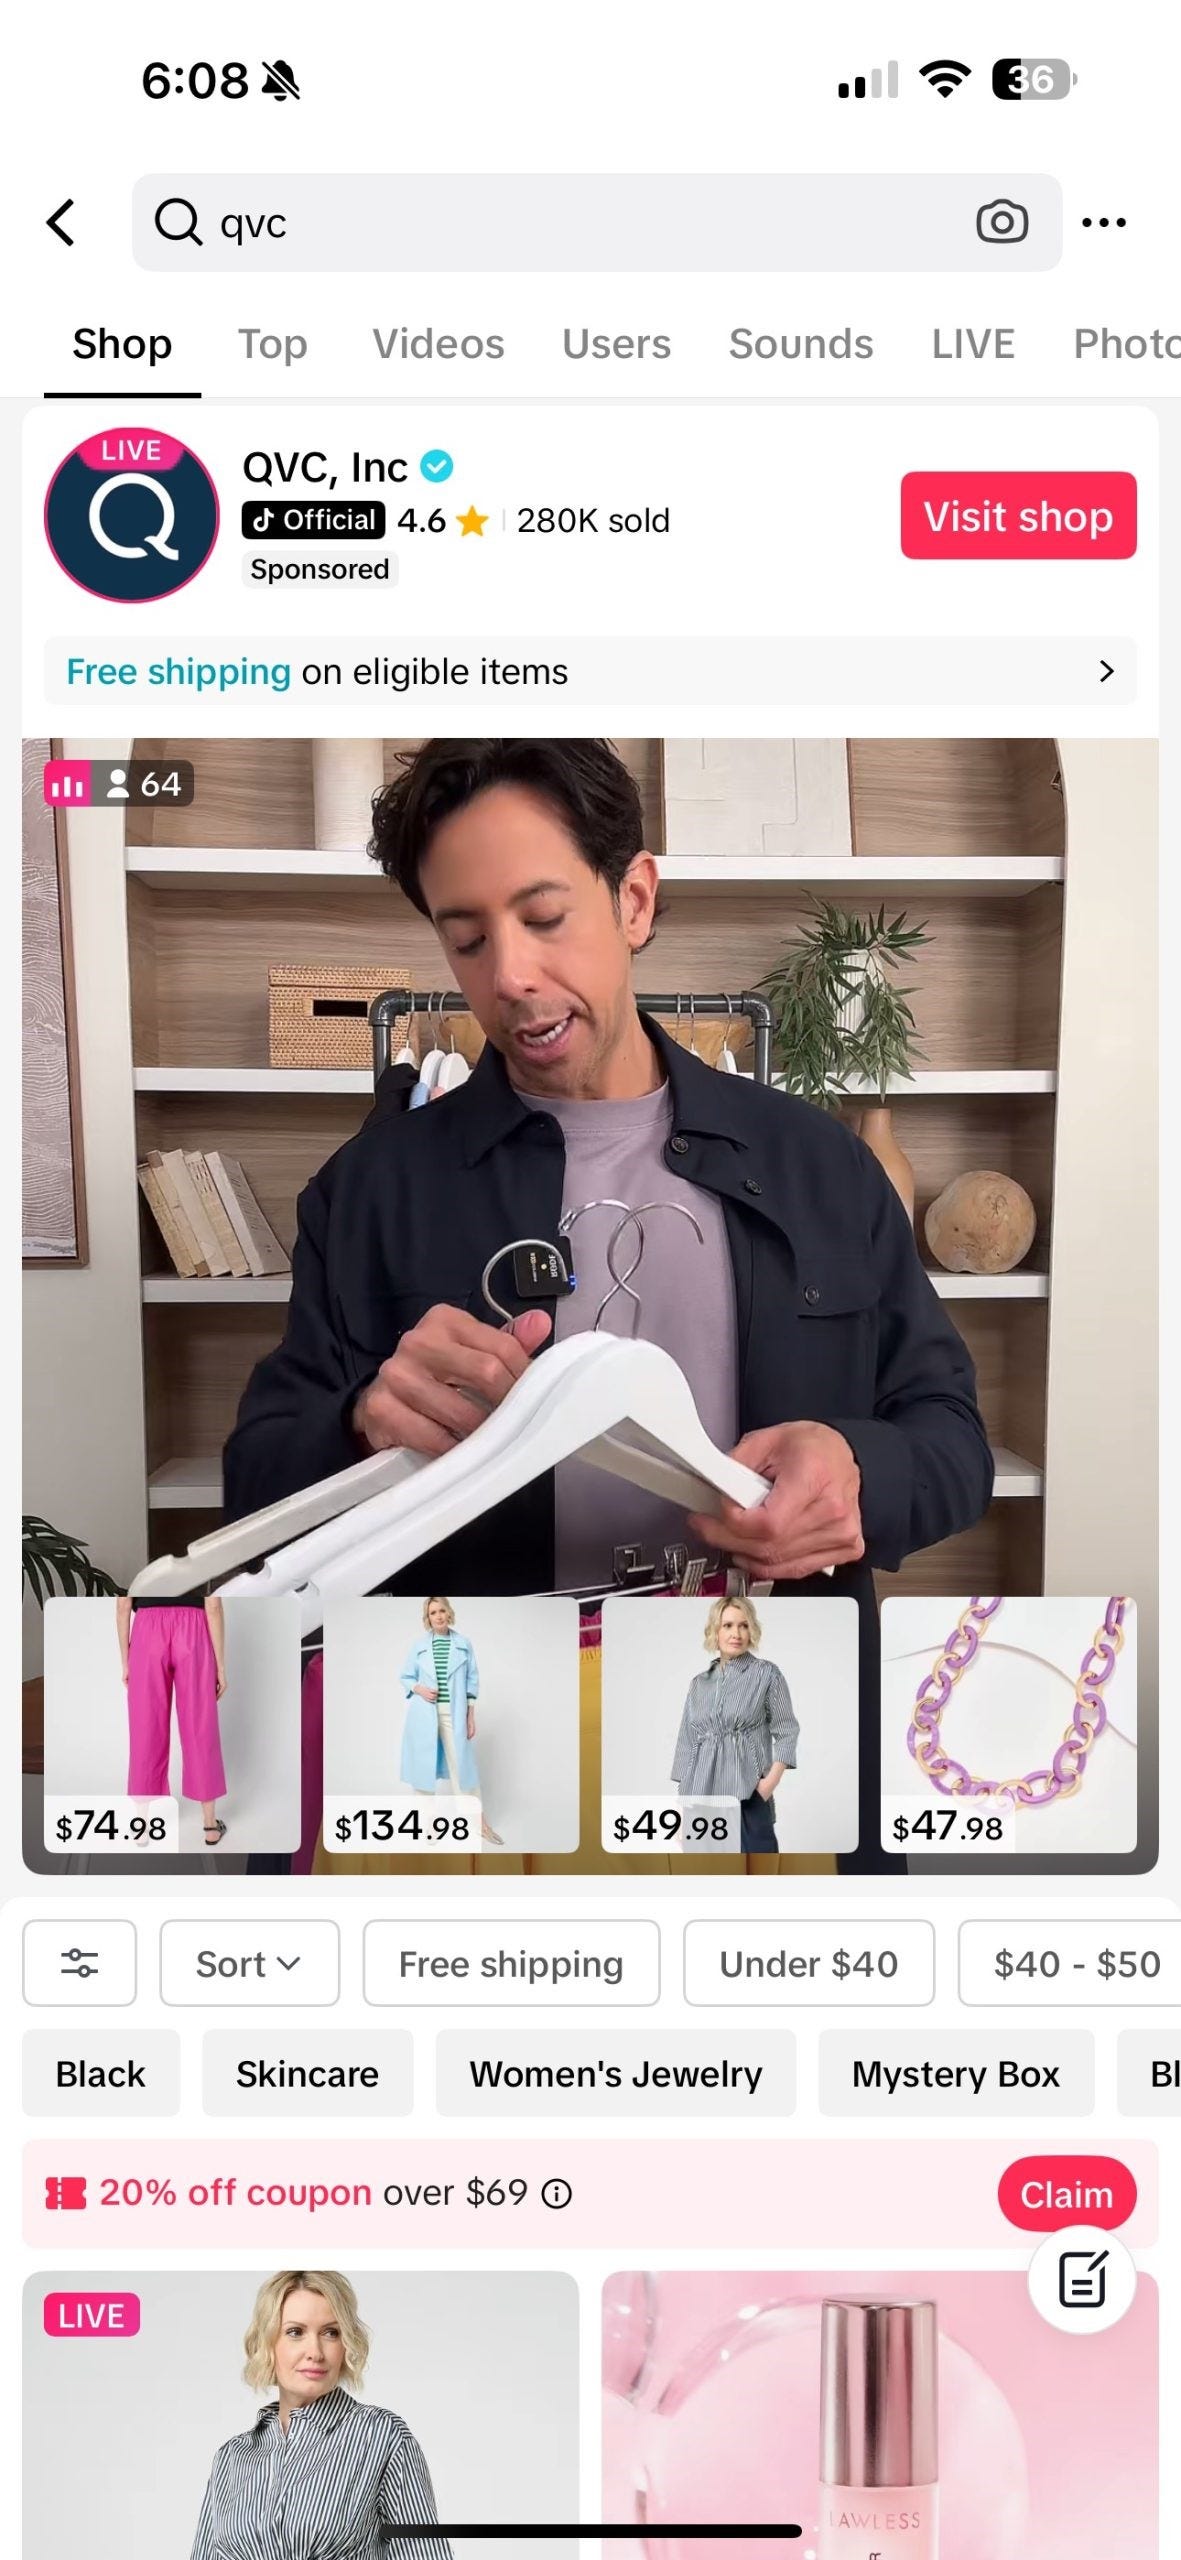
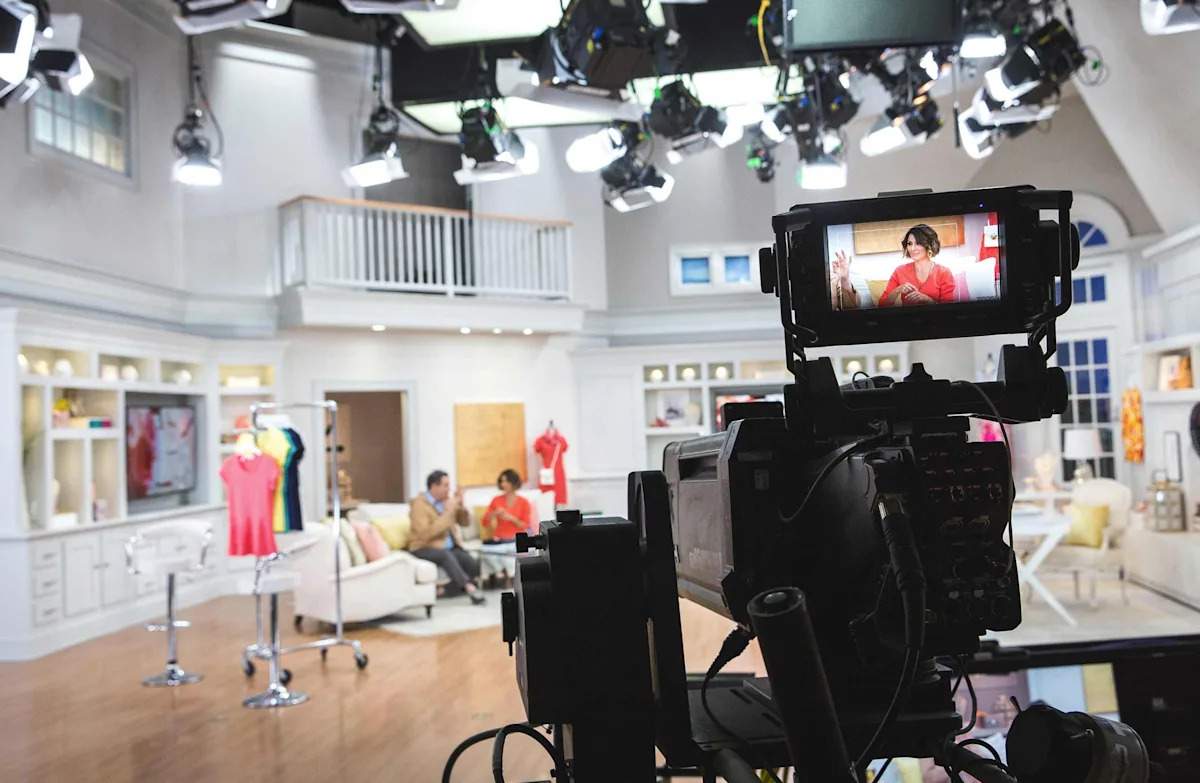
QVC Group, Inc., formerly Qurate Retail, Inc., is a live social shopping company that redefines the shopping experience through video-driven commerce on every screen, from smartphones and tablets to laptops and televisions. The Company's retail brands include QVC, HSN, Ballard Designs, Frontgate, Garnet Hill and Grandin Road. The Company reaches more than 200 million homes worldwide via 15 television channels, which are available on cable/satellite television, free over-the-air television, and FAST and other digital livestreaming television. It also reaches millions of customers via its QVC+ and HSN+ streaming experience, Facebook, Instagram, TikTok, YouTube, Pinterest, websites, mobile apps, print catalogs, and in-store destinations. It also holds various minority interests.

arrow icon

What is the price predicton of QVCGA Stock?

Wall Street analysts forecast QVCGA stock price to fall over the next 12 months. According to Wall Street analysts, the average 1-year price target for QVCGA is  USD with a low forecast of USD and a high forecast of USD. However, analyst price targets are subjective and often lag stock prices, so investors should focus on the objective reasons behind analyst rating changes, which better reflect the company's fundamentals.

arrow icon

What is QVC Group Inc (QVCGA)'s revenue for the last quarter?

QVC Group Inc revenue for the last quarter amounts to 2.21B USD, decreased -5.59 % YoY.

arrow icon

What is QVC Group Inc (QVCGA)'s earnings per share (EPS) for the last quarter?

QVC Group Inc. EPS for the last quarter amounts to -9.92 USD, increased 242.07 % YoY.

arrow icon

What changes have occurred in the market's expectations for QVC Group Inc (QVCGA)'s fundamentals?

The market is revising No Change the revenue expectations for QVCGA for , with the revenue forecasts being adjusted by % over the past three months. During the same period, the stock price has changed by 3.03%.
arrow icon

How many employees does QVC Group Inc (QVCGA). have?

QVC Group Inc (QVCGA) has 18900 emplpoyees as of December 06 2025.

arrow icon

What is QVC Group Inc (QVCGA) market cap?

Today QVCGA has the market capitalization of 75.52M USD.

Intellectia LogoIntellectiaIntellectia LogoIntellectia

Redefine Your Investment Decisions

TwitterTwitterYoutubeYoutubeQuoraQuoraDiscordDiscordLinkedinLinkedinTelegramTelegram
AppStoreGooglePlay

Copyright © 2025 Intellectia.AI. All Rights Reserved.

pci certified logo
Company
HomeContactAbout UsNews Release
Compare
TradingViewSeeking Alpha
Features
Financial AI AgentStock Technical AnalysisStock MonitorHedge Fund TrackerAI ScreenerDaytrading Center
Strategies
AI Stock PickerSwing TradingStock Chart PatternsEarnings TradingDaytrading CenterAI Earnings PredictionQuant AIWhales Auto TrackerBacktesting Playground
Free Tools
Dividend CalculatorDividend Yield CalculatorOptions Profit Calculator
Resource
BlogTutorialEarningsTrending StocksCrypto MarketPartner ProgramTerms of UsePrivacy PolicySecuritySitemap
Start for Free