OBE Overview
-
$
0.000
0.000(0.000%)
At close0.000(0.000%)Aft-market
ET
Loading chart...


The current price of OBE is 8.01 USD — it has increased 0.75
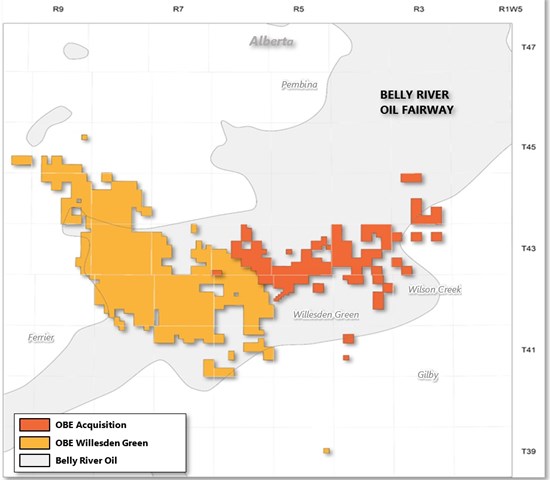
Obsidian Energy Ltd is a Canada-based intermediate-sized oil and gas producer with a portfolio of assets, primarily in the Peace River, Willesden Green, and Viking areas in Alberta. The Company's business is to explore for, develop and hold interests in oil and natural gas properties and related production infrastructure in the Western Canada Sedimentary Basin. Its principal business consists of the exploration, development and production of petroleum resources. The Peace River is a cold-flow heavy oil resource within the heart of the Peace River Oilsands region. It has full ownership of a large, contiguous approximately 700 sections of land at Peace River. Willesden Green & PCU#11 provides an extensive acreage totaling 200 net sections prospective for Cardium, Belly River and Mannville formations. The Viking is a light oil resource play with associated natural gas located in central Alberta.
Wall Street analysts forecast OBE stock price to rise over the next 12 months. According to Wall Street analysts, the average 1-year price target for OBE is7.02 USD with a low forecast of 6.84 USD and a high forecast of 7.20 USD. However, analyst price targets are subjective and often lag stock prices, so investors should focus on the objective reasons behind analyst rating changes, which better reflect the company's fundamentals.
Obsidian Energy Ltd revenue for the last quarter amounts to 140.00M USD, decreased -26.00
Obsidian Energy Ltd. EPS for the last quarter amounts to -0.28 USD, decreased -240.00
Obsidian Energy Ltd (OBE) has 148 emplpoyees as of July 05 2026.
Today OBE has the market capitalization of 534.88M USD.