

PAGE NOT FOUND
Oops! It seems the page you are looking for does not exist...
Back to HomepageBlog
Get What You Are Looking For Here
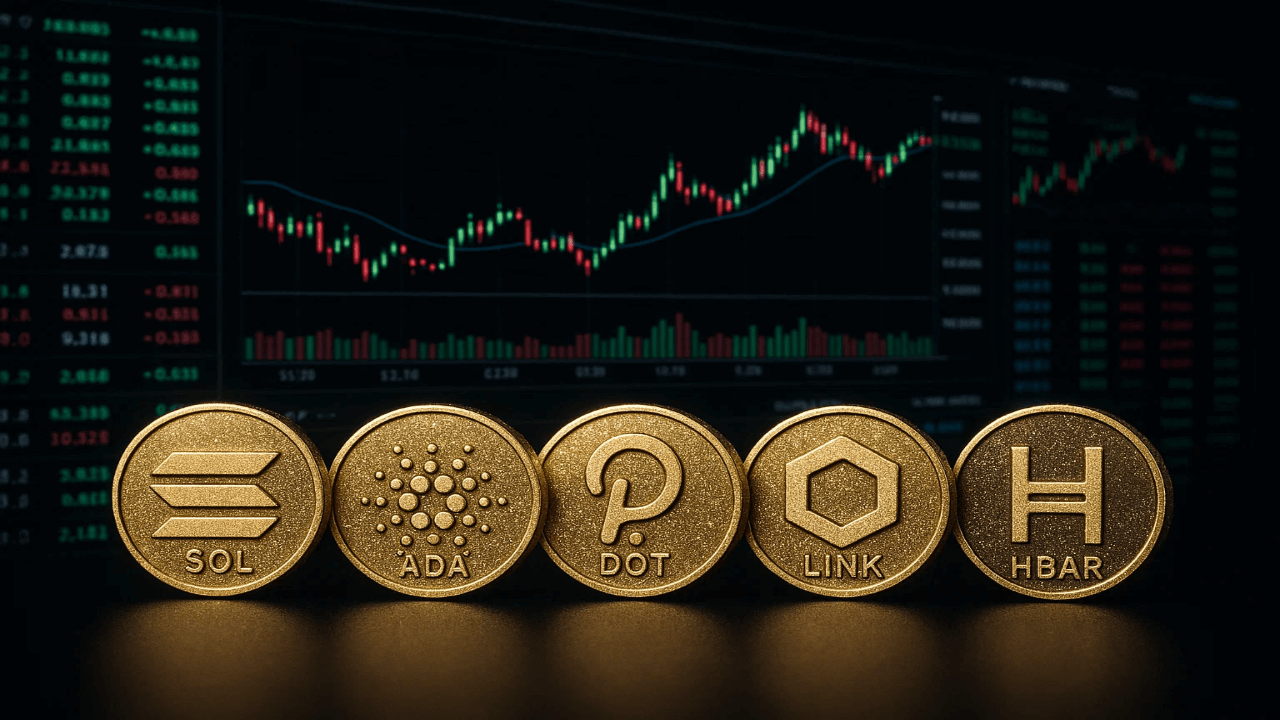
Crypto Analysis
Next Crypto to Explode: 5 Coins to Watch in 2026 - Intellectia AI™
Jason Huang1 days ago
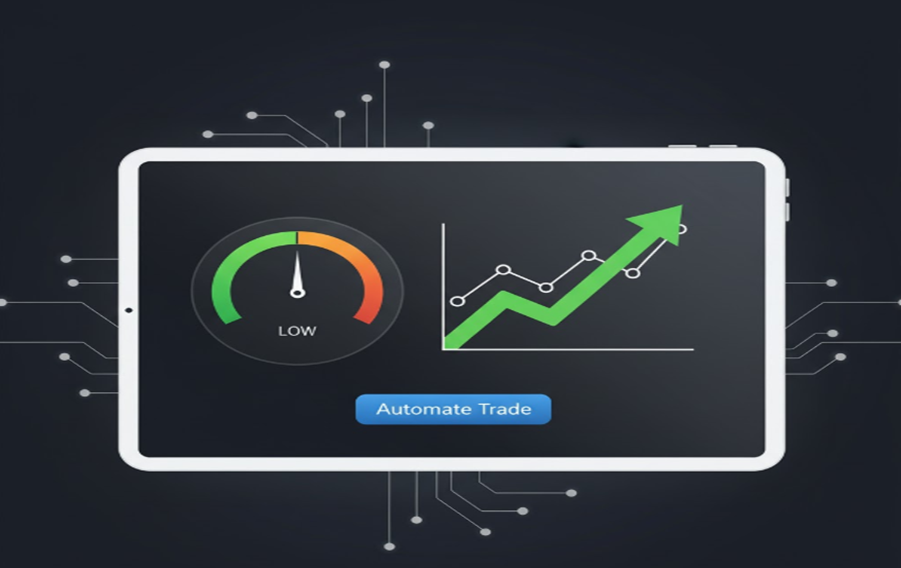
Financial Analysis
Top 5 AI Stock Trading Bots for Beginners - Intellectia AI™
Jason Huang1 days ago
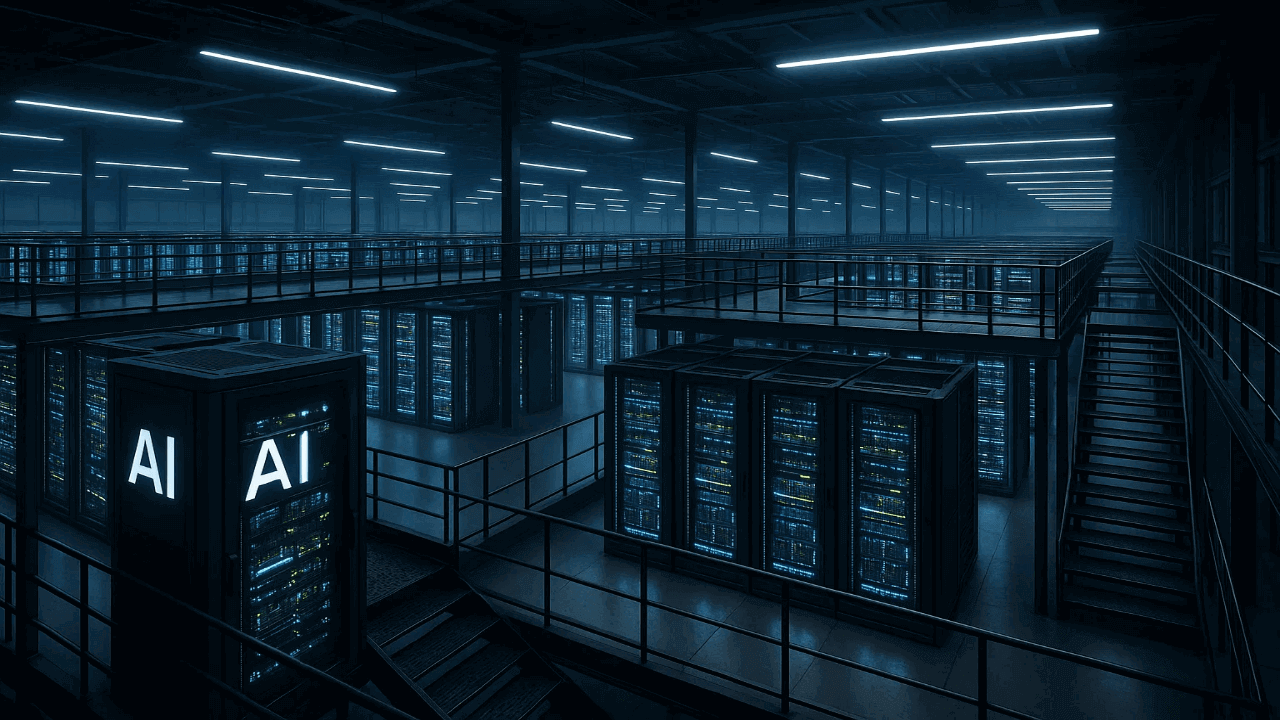
Financial Analysis
Top 4 AI Penny Stocks Under $1 for 2026 - Intellectia AI™
Jason Huang2 days ago
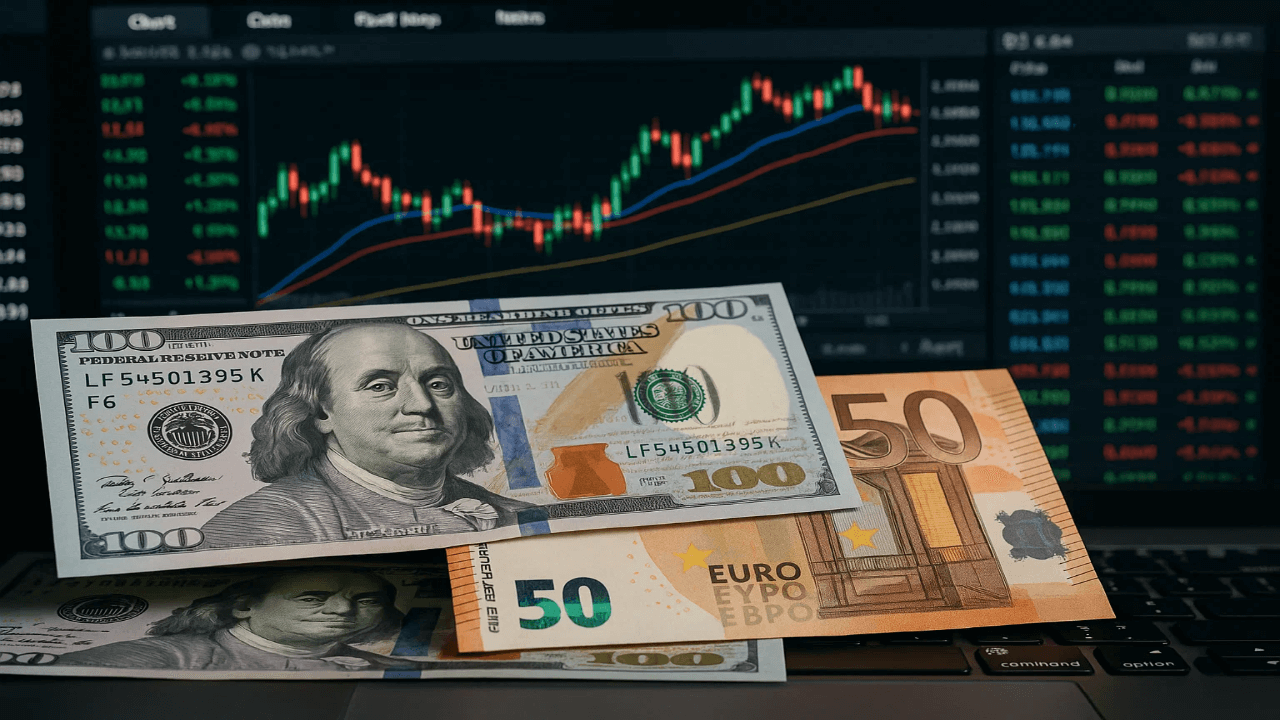
Financial Analysis
The 2026 Dividend Kings List: 5 Stocks for Unshakeable Passive Income
Jason Huang2 days ago


