Analysis of Stocks Approaching Market Highs
Written by Emily J. Thompson, Senior Investment Analyst
Updated: May 02 2026
0mins
Source: Yahoo Finance
- Enact Holdings Risks: Enact Holdings (NASDAQ:ACT) has a one-month return of +5.3%, but stagnant net premiums over the past five years and flat sales projections for the next 12 months indicate insufficient growth potential amid market headwinds.
- Nelnet Profitability Concerns: Nelnet (NYSE:NNI) shows a one-month return of +10.6%, yet its annual earnings per share growth of only 4.3% and a high net-debt-to-EBITDA ratio of 12x raise risks of forced asset sales, reflecting management's struggles in effective fund allocation.
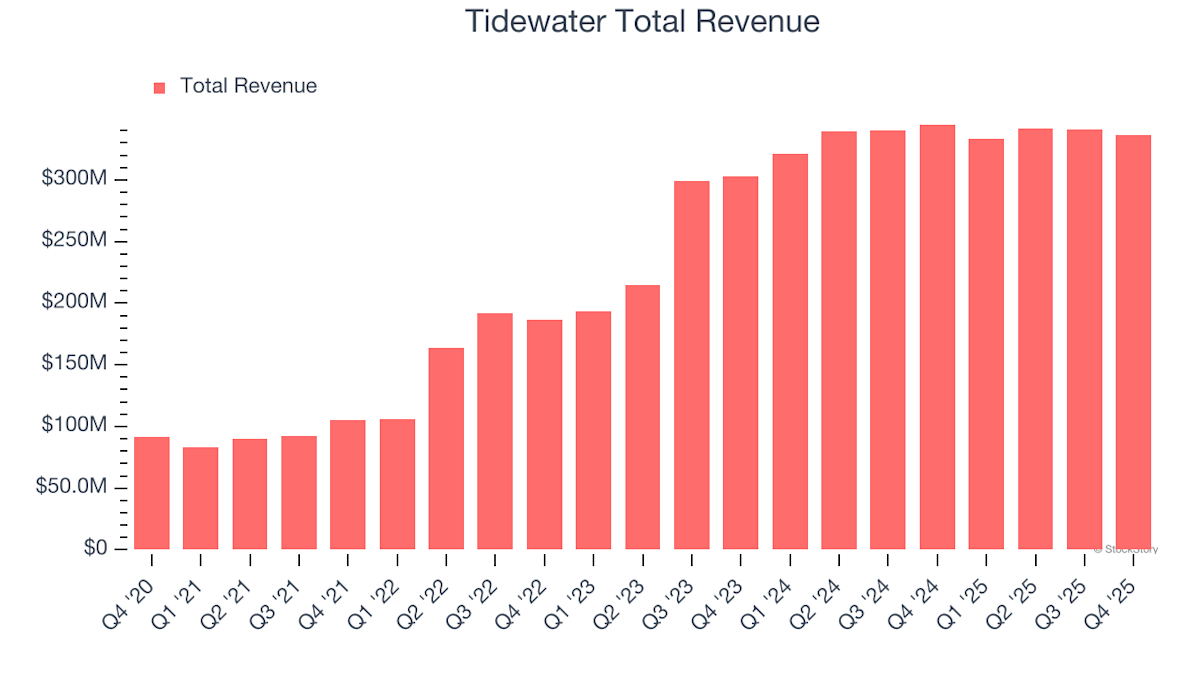
- Tidewater Growth Potential: Tidewater (NYSE:TDW) has a one-month return of +7.3%, with an impressive annual revenue growth rate of 27.8%, indicating successful market share gains, while increased EBITDA profits and a robust free cash flow margin of 14.8% provide multiple capital deployment options.
- Market Dynamics Shift: The current market is rapidly distinguishing quality stocks from overvalued ones, with an AI system flagging six new stocks each week to help investors identify potential winners in a fast-changing environment.
Trade with 70% Backtested Accuracy
Stop guessing "Should I Buy TDW?" and start using high-conviction signals backed by rigorous historical data.
Sign up today to access powerful investing tools and make smarter, data-driven decisions.
Analyst Views on TDW
Wall Street analysts forecast TDW stock price to fall
1 Analyst Rating
0 Buy
1 Hold
0 Sell
Hold
Current: 67.710
Low
65.00
Averages
65.00
High
65.00
Current: 67.710
Low
65.00
Averages
65.00
High
65.00
About TDW
Tidewater Inc. is the owner and operator of offshore support vessels providing offshore energy exploration, production and offshore wind activities. The Company's segments include the Americas, Asia Pacific, Middle East, Europe/Mediterranean and West Africa. Its vessels and associated services support all phases of offshore crude oil and natural gas (also referred to as oil and gas) exploration activities, field development, production and maintenance, as well as windfarm development and maintenance. Its services include transporting supplies and personnel necessary to sustain drilling, workovers, production activities, field abandonment, dismantlement and restoration activities; offshore construction and seismic and subsea support; geotechnical survey support for windfarm construction, and a variety of other specialized services such as pipe and cable laying. It offers a diversified fleet of offshore service vessels, with around 208 vessels serving customers in over 30 countries.
About the author

Emily J. Thompson
Emily J. Thompson, a Chartered Financial Analyst (CFA) with 12 years in investment research, graduated with honors from the Wharton School. Specializing in industrial and technology stocks, she provides in-depth analysis for Intellectia’s earnings and market brief reports.

VanEck Oil Service ETF Underperforms Amid Market Decline
- ETF Decline: The VanEck Oil Service ETF fell approximately 3.8% in Thursday afternoon trading, indicating underperformance amid market volatility, which could impact investor confidence and lead to capital outflows.
- Weak Individual Stocks: Within the ETF, shares of Tidewater dropped about 7.3%, while Transocean fell approximately 6.9%, with these weak performances potentially exacerbating the overall downward pressure on the ETF and reflecting challenges in the oil service sector.
- Market Sentiment Impact: Due to overall market uncertainty, investors may adopt a cautious stance towards the oil service industry, leading to price pressures on both the ETF and its component stocks, which could affect financing and investment decisions in the sector.
- Investor Focus: As oil prices fluctuate and industry outlook remains unclear, investors may need to reassess their investment strategies regarding the oil service ETF to navigate potential market risks and revenue uncertainties.
See More

Tidewater Inc RSI Analysis Indicates Potential Buy Opportunity
- RSI Interpretation: Tidewater Inc's relative strength index (RSI) stands at 29.5, significantly lower than the energy sector average of 41.1, indicating that recent selling pressure may be nearing exhaustion, prompting investors to consider entry points.
- Price Range Analysis: With a 52-week low of $44.11 and a high of $93.13, TDW's current trading price of $68.15 suggests it is fluctuating near its high, potentially attracting buyer interest.
- Market Performance Overview: Tidewater Inc shares are currently down approximately 3.9% on the day, reflecting a cautious short-term sentiment in the market, which may present a buying opportunity for investors.
- Industry Comparison: The RSI for WTI Crude Oil is at 27.9, Henry Hub Natural Gas at 55.6, and the 3-2-1 Crack Spread at 21.4, illustrating Tidewater's relative position within the energy sector, which may entice investors looking for rebounds.
See More

Tidewater Inc. Q1 2026 Earnings Call Highlights
- Revenue Growth: Tidewater Inc. reported Q1 revenue of $326.2 million, primarily driven by higher vessel utilization and stronger day rates, exceeding expectations and demonstrating robust market performance.
- Margin Improvement: The gross margin for Q1 was 48.8%, slightly up from 48.7% in the previous quarter and over 3 percentage points above internal plans, reflecting successful cost control and operational efficiency.
- Free Cash Flow Generation: The company generated $34 million in free cash flow during Q1, and although no share repurchases were made, it retains $500 million in buyback authorization, showcasing strong cash flow management capabilities.
- Stable Full-Year Outlook: Tidewater maintains its 2026 revenue guidance between $1.43 billion and $1.48 billion, despite anticipating a 5 percentage point decline in gross margin due to rising costs in Q2, indicating a cautiously optimistic view on future market conditions.
See More

Tidewater Reports Significant Drop in Q1 Earnings
- Significant Earnings Decline: Tidewater Inc. reported Q1 earnings of $5.976 million, or $0.12 per share, a stark drop from $42.320 million and $0.83 per share last year, indicating increased pressure on profitability.
- Slight Revenue Decrease: The company's revenue for the quarter was $326.222 million, down 2.2% from $333.444 million last year, reflecting weak market demand and intensified competition negatively impacting revenue.
- Financial Performance Warning: The dual decline in earnings and revenue may undermine investor confidence, leading to stock price volatility, necessitating Tidewater to implement effective measures to restore profitability and market competitiveness.
- Uncertain Future Outlook: Given the current economic environment, Tidewater's profitability faces challenges, and future attention should be on industry trends and company strategic adjustments to mitigate risks arising from market changes.
See More

TIDEWATER INC CONFIRMS 2026 REVENUE FORECAST OF $1.43 BILLION TO $1.48 BILLION
- Revenue Guidance for 2026: Tidewater Inc. has provided revenue guidance for 2026, estimating between $1.43 billion and $1.48 billion.
- Financial Outlook: The guidance reflects the company's expectations for growth and performance in the upcoming years.
See More
Tidewater Earnings Preview: Revenue Expected to Decline
- Revenue Performance: Tidewater reported revenues of $336.8 million last quarter, down 2.4% year-on-year, exceeding analyst expectations but missing EPS and EBITDA estimates, indicating challenges ahead for the company.
- Market Expectations: This quarter, the market anticipates a 3.3% year-on-year revenue decline for Tidewater, contrasting sharply with the 3.8% growth recorded in the same quarter last year, reflecting overall industry weakness.
- Analyst Confidence: Over the past 30 days, most analysts have reaffirmed their estimates for Tidewater, suggesting they expect the company to remain stable heading into earnings, as it rarely misses revenue estimates historically.
- Peer Performance: In the upstream and integrated segment, Solaris Energy Infrastructure reported a year-on-year growth of 55.3%, while Weatherford saw a decline of 3.4%, highlighting a divergence in industry performance, with Tidewater's stock up 3% during this period.
See More
VanEck Oil Service ETF Underperforms Amid Market Decline
- ETF Decline: The VanEck Oil Service ETF fell approximately 3.8% in Thursday afternoon trading, indicating underperformance amid market volatility, which could impact investor confidence and lead to capital outflows.
- Weak Individual Stocks: Within the ETF, shares of Tidewater dropped about 7.3%, while Transocean fell approximately 6.9%, with these weak performances potentially exacerbating the overall downward pressure on the ETF and reflecting challenges in the oil service sector.
- Market Sentiment Impact: Due to overall market uncertainty, investors may adopt a cautious stance towards the oil service industry, leading to price pressures on both the ETF and its component stocks, which could affect financing and investment decisions in the sector.
- Investor Focus: As oil prices fluctuate and industry outlook remains unclear, investors may need to reassess their investment strategies regarding the oil service ETF to navigate potential market risks and revenue uncertainties.
See More
Tidewater Inc RSI Analysis Indicates Potential Buy Opportunity
- RSI Interpretation: Tidewater Inc's relative strength index (RSI) stands at 29.5, significantly lower than the energy sector average of 41.1, indicating that recent selling pressure may be nearing exhaustion, prompting investors to consider entry points.
- Price Range Analysis: With a 52-week low of $44.11 and a high of $93.13, TDW's current trading price of $68.15 suggests it is fluctuating near its high, potentially attracting buyer interest.
- Market Performance Overview: Tidewater Inc shares are currently down approximately 3.9% on the day, reflecting a cautious short-term sentiment in the market, which may present a buying opportunity for investors.
- Industry Comparison: The RSI for WTI Crude Oil is at 27.9, Henry Hub Natural Gas at 55.6, and the 3-2-1 Crack Spread at 21.4, illustrating Tidewater's relative position within the energy sector, which may entice investors looking for rebounds.
See More
Tidewater Inc. Q1 2026 Earnings Call Highlights
- Revenue Growth: Tidewater Inc. reported Q1 revenue of $326.2 million, primarily driven by higher vessel utilization and stronger day rates, exceeding expectations and demonstrating robust market performance.
- Margin Improvement: The gross margin for Q1 was 48.8%, slightly up from 48.7% in the previous quarter and over 3 percentage points above internal plans, reflecting successful cost control and operational efficiency.
- Free Cash Flow Generation: The company generated $34 million in free cash flow during Q1, and although no share repurchases were made, it retains $500 million in buyback authorization, showcasing strong cash flow management capabilities.
- Stable Full-Year Outlook: Tidewater maintains its 2026 revenue guidance between $1.43 billion and $1.48 billion, despite anticipating a 5 percentage point decline in gross margin due to rising costs in Q2, indicating a cautiously optimistic view on future market conditions.
See More
Tidewater Reports Significant Drop in Q1 Earnings
- Significant Earnings Decline: Tidewater Inc. reported Q1 earnings of $5.976 million, or $0.12 per share, a stark drop from $42.320 million and $0.83 per share last year, indicating increased pressure on profitability.
- Slight Revenue Decrease: The company's revenue for the quarter was $326.222 million, down 2.2% from $333.444 million last year, reflecting weak market demand and intensified competition negatively impacting revenue.
- Financial Performance Warning: The dual decline in earnings and revenue may undermine investor confidence, leading to stock price volatility, necessitating Tidewater to implement effective measures to restore profitability and market competitiveness.
- Uncertain Future Outlook: Given the current economic environment, Tidewater's profitability faces challenges, and future attention should be on industry trends and company strategic adjustments to mitigate risks arising from market changes.
See More
TIDEWATER INC CONFIRMS 2026 REVENUE FORECAST OF $1.43 BILLION TO $1.48 BILLION
- Revenue Guidance for 2026: Tidewater Inc. has provided revenue guidance for 2026, estimating between $1.43 billion and $1.48 billion.
- Financial Outlook: The guidance reflects the company's expectations for growth and performance in the upcoming years.
See More
Tidewater Earnings Preview: Revenue Expected to Decline
- Revenue Performance: Tidewater reported revenues of $336.8 million last quarter, down 2.4% year-on-year, exceeding analyst expectations but missing EPS and EBITDA estimates, indicating challenges ahead for the company.
- Market Expectations: This quarter, the market anticipates a 3.3% year-on-year revenue decline for Tidewater, contrasting sharply with the 3.8% growth recorded in the same quarter last year, reflecting overall industry weakness.
- Analyst Confidence: Over the past 30 days, most analysts have reaffirmed their estimates for Tidewater, suggesting they expect the company to remain stable heading into earnings, as it rarely misses revenue estimates historically.
- Peer Performance: In the upstream and integrated segment, Solaris Energy Infrastructure reported a year-on-year growth of 55.3%, while Weatherford saw a decline of 3.4%, highlighting a divergence in industry performance, with Tidewater's stock up 3% during this period.
See More


