Iran's IRGC Strikes Gulf Energy Hubs in Retaliation

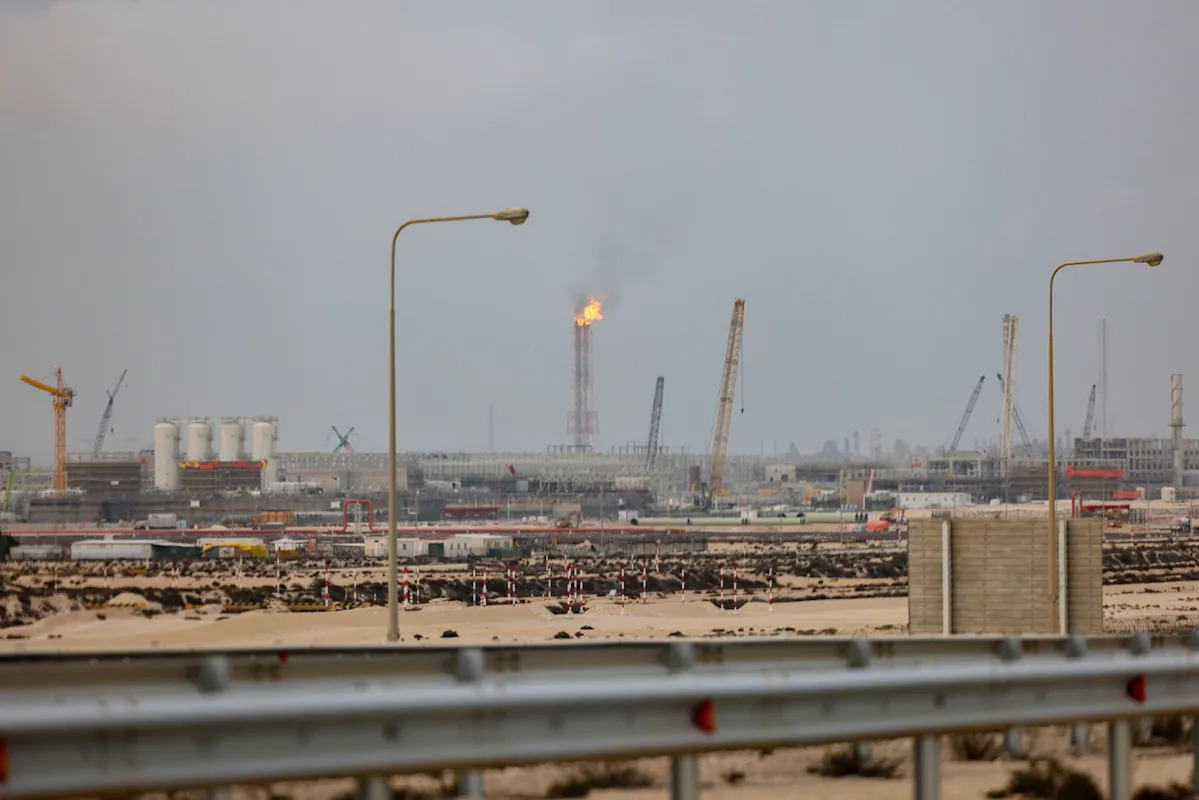
- Energy Facilities Attacked: Iran's IRGC launched retaliatory strikes on Gulf energy facilities, igniting fires at Qatari LNG terminals, which directly impacts global energy supply and risks triggering a broader economic crisis.
- Surge in Oil and Gas Prices: Brent crude prices soared above $110 during Thursday's trading, marking a more than 50% increase since the war began at $70, while European natural gas benchmark TTF prices surged by 28-30%, reflecting strong market reactions to supply disruptions.
- Global LNG Supply Tightens: QatarEnergy suspended production due to the attacks, and if this halt lasts beyond two months, energy analytics firm Wood Mackenzie warns it could “fundamentally change the global gas market outlook,” with global LNG supply contracting nearly 20%.
- Market Reactions: JPMorgan cut its year-end S&P 500 target from 7,500 to 7,200 points, cautioning that oil prices rising over 30% historically precede demand contractions and recessions, leading to declines in global equity markets as energy costs surged.
Get Real-Time Alerts for Any Crypto Movement
Technical Analysis for BTC
Technical Sentiment Analysis for Bitcoin (BTC). As of , Bitcoin (BTC) is exhibiting a Strong buy technical sentiment. Our proprietary analysis, which aggregates 4 technical signals, shows that 4 indicators are flashing buy, while 0 are indicating sell.
Momentum Indicators: RSI, MACD & Overbought/Oversold Status. Currently, the Relative Strength Index (RSI) for BTC stands at -, which suggests a Neutral condition. Meanwhile, the MACD (12, 26) indicator is at -, providing a Neutral signal for short-term momentum. Other oscillators like the Stochastic Oscillator at - and the Commodity Channel Index (CCI) at - further confirm a - outlook for the crypto.
Support, Resistance & Moving Averages. From a structural perspective, BTC is trading below its 60-day moving average of $- and below its 200-day long-term moving average of $-. Key price levels to watch include the immediate resistance at $- and strong support at $-. A break above $- could signal a bull continuation, while falling below $- may test the next Fibonacci floor at $-.
Bitcoin (BTC) Support & Resistance Level
| Name | S3 | S2 | S1 | Pivot Points | R1 | R2 | R3 |
|---|---|---|---|---|---|---|---|
| Classic | 61039.787 | 64916.569 | 68246.437 | 72123.219 | 75453.087 | 79329.869 | 82659.737 |
| Fibonacci | 64916.569 | 67669.509 | 69370.278 | 72123.219 | 74876.159 | 76576.928 | 79329.869 |
About BTC
About the author