Swing Trading Has Never Been Easier
Swing trading remains a favorite among active investors seeking consistent short-term gains. That’s why we built SwingMax—Intellectia’s AI-powered swing trading engine designed to help you make smarter, more confident trades with less guesswork.
How Our New SwingMax Feature Works
SwingMax uses advanced algorithms to scan for the best opportunities in stocks. The latest update features a fully optimized entry algorithm—meaning it’s even better at spotting relative price lows to help you buy in at just the right moment.
When it’s time to sell, SwingMax now recommends staged exits: you’ll receive up to two sell targets for every trade, so you can lock in gains step by step and ride the trend for as long as possible.


Note: Crypto support is under further development and not included in this release.
Risk Management
Risk control remains at the heart of SwingMax. For each trade, the system suggests a stop-loss price (default -15% from entry), which you can customize to match your risk preference. This helps limit downside even if the market moves against your position.
Key Features
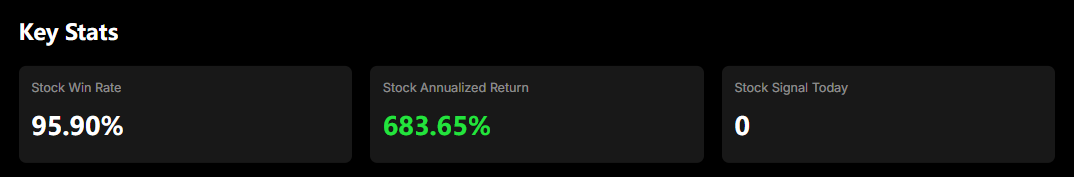
At the top of your SwingMax dashboard, you’ll find:
- Stock Win Rate: The percentage of profitable trades
- Stock Annualized Return: Projected annual return based on backtested results
- Stock Signal Today: Number of new signals generated today
Each stock falls into one of two categories:
- Opening: Stocks with an active entry signal (open position)
- Closed: Stocks where the system’s sell signal has been triggered and the trade cycle is complete
Opening List
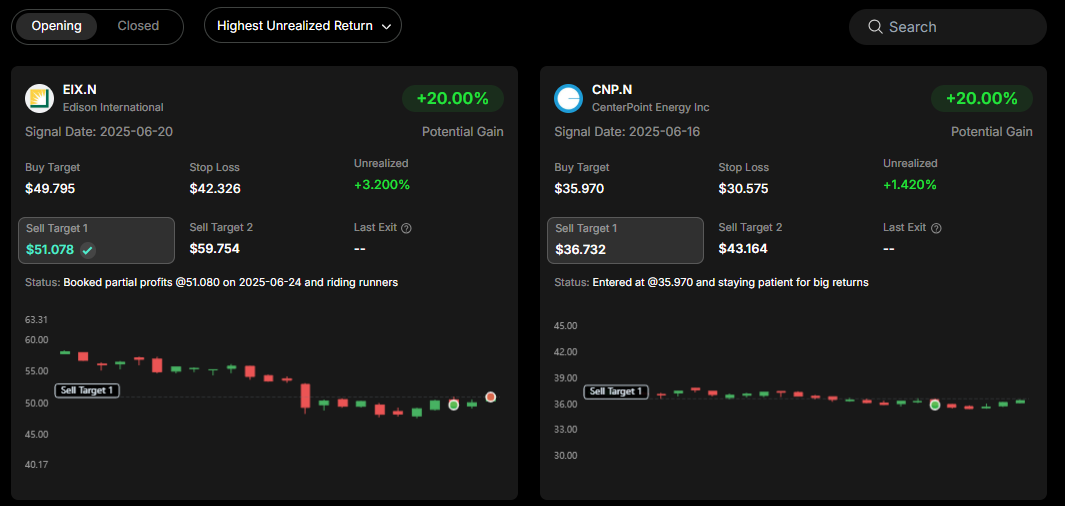
The opening list displays all stocks with a current buy signal. For each, you’ll see:
- Buy Target: The price at which our entry signal was triggered
- Stop Loss: Recommended risk limit
- Sell Target 1 & Sell Target 2: Staged profit-taking points to help you lock in gains step by step
- Unrealized Return: Your floating gain/loss if you entered at the signal
- Potential Gain: Maximum projected profit
- Last Exit:
When price breaks above Sell Target 2, trail your stop to that level and ride the runners—so you can secure gains and still participate in any further upside.
- Status: Guidance on the current trade signal
For every open trade, we provide clear, step-by-step guidance to help you lock in profits and manage risk with a staged exit approach.
Best Practice:
When the status first recommends taking partial profit, consider selling 30% of your position and move your stop loss up to Sell Target 1.
If the price continues to climb and guidance suggests taking profit again, sell another 30% and raise your stop loss to Sell Target 2.
For the remaining 40%, set a trailing stop at 3% below the highest price achieved, as long as the price stays above Target 2. This strategy lets you secure gains while keeping some exposure for further upside.
You can sort by latest entry, highest potential, or oldest entry to quickly focus on the most attractive signals.
Closed List
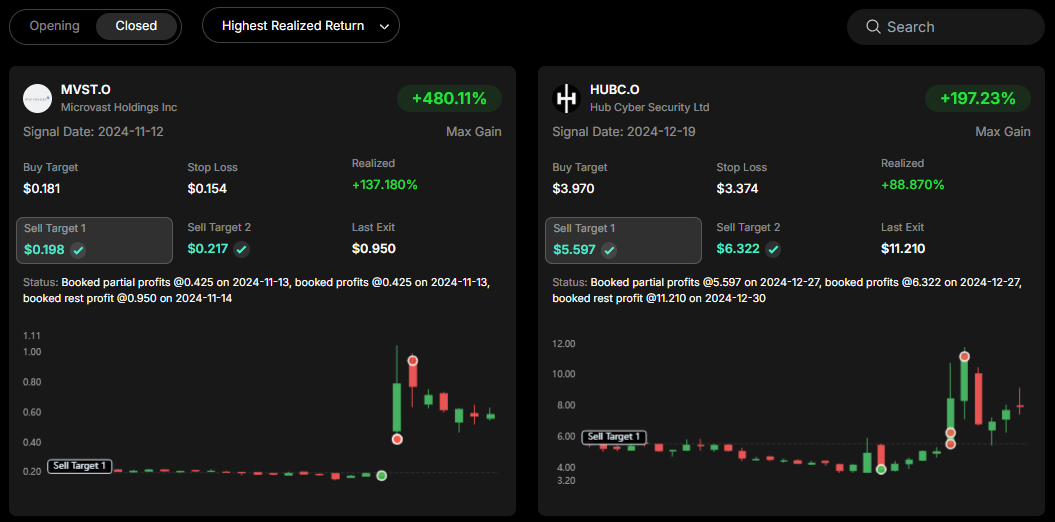
Closed signals display:
- Entry Price/Date
- Exited Price/Date
- Sell Target 1 & Sell Target 2: Prices at which partial or full profits were booked
- Realized Return: Total return achieved for the completed trade
- Status: Timeline of how profits were booked or when the stop-loss was triggered
You can sort by latest exit, highest gain, or oldest exit to examine our system's profitability and reliability.


Best Practices for Maximizing Success
- Daily Swing Signals: Get a fresh batch of signals when market conditions are favorable. New opportunities are identified only when the algorithm detects a strong setup—so you receive actionable, AI-powered insights, not noise.
- Simplifies Trading Decisions: SwingMax helps reduce research time by surfacing only the best swing trade opportunities, but we still recommend you check for any major market events (earnings, Fed, etc.) that could impact a stock.
- Do Your Due Diligence: AI can’t predict black swans or market-wide shocks. Always stay informed about external risks that could affect your positions.
Important Disclaimer: Know the Risks
- Past Performance Doesn’t Guarantee Future Results: While SwingMax has been successful in the past, there's no certainty that these results will continue in the future.
- AI Isn’t Perfect: The AI model provides optimized trading signals based on technical data, but even the best models can make mistakes. Use your judgment when following the signals.
- Watch for Major Events: AI doesn’t fully account for major market-moving events like widespread market drops or corporate disasters. Always conduct your own research to ensure you’re not missing something that could impact your investment.
Final Thoughts
SwingMax is designed to make swing trading more efficient and less complex. By following the buy and sell signals, you can streamline your decision-making and improve your trading performance.
Remember, while SwingMax optimizes timing, you are the final decision-maker. Stay informed, consider broader market conditions, and use SwingMax to guide your trades with confidence.