Intellectia LogoIntellectia
Product
Resources
Markets
News
Partner Program
Pricing
Log inTry for Free
Intellectia Logo
Log in
Intellectia Logo

Product

Features
Financial AI Agent
Stock Technical Analysis
Stock Monitor
Hedge Fund Tracker
AI Screener
Trading Strategies
AI Stock Picker
Swing Trading
Quant AI
Stock Chart Patterns
Daytrading Center
AI Earnings Prediction
Whales Auto Tracker
Backtesting Playground

Resources

Learn
Blog
Earnings
Tutorial
Help Center
Company
About Us
Contact
Press
Reward Program
Partner Program
Tools
Dividend Calculator
Dividend Yield Calculator
Options Profit Calculator
Compare
TradingView
SeekingAlpha

Markets

Trending Stocks
Hot Crypto
Trending News
All Stocks

News

Trading News
Overview
Top News
Daily Market Brief
Earnings
Latest
Newswire
Stock News
Crypto News
Monitor News
Partner ProgramPricing
Start for Free
  1. Home
  2. >
  3. Stock
  4. >
  5. YSG
stocks logo

YSG

-
collectAdd to Watchlistadvanced chartAdvanced Chart
$
0.000
0(0.000%)1D
collectadvanced chart
    Overview
    Forecast
    Valuation
    Earnings
High
--
Open
--
VWAP
--
Vol
--
Mkt Cap
--
Low
--
Amount
--
EV/EBITDA(TTM)
--
Total Shares
--
EV
--
EV/OCF(TTM)
--
P/S(TTM)
--
Intellectia AI SwingMax

Market Estimates

Earnings Estimates
Earnings Estimates
Revenue
YoY Chg
EPS
YoYChg
FY2024Q3
FY2024Q4
--
--
0.050
-116.67%
--
--
0.220
-112.94%
Estimates Revision
The market is revising No Change the revenue expectations for Yatsen Holding Limited (YSG) for FY2025, with the revenue forecasts being adjusted by 0% over the past three months. During the same period, the stock price has changed by -39.94%.
Revenue Estimates for FY2025
No Change
down Image
0.00%
In Past 3 Month
EPS Estimates for FY2025
No Change
down Image
0.00%
In Past 3 Month
Stock Price
Go Down
down Image
-39.94%
In Past 3 Month

Valuation Metrics

The current forward P/E ratio for Yatsen Holding Ltd (YSG.N) is 15.68, compared to its 5-year average forward P/E of -39.85. For a more detailed relative valuation and DCF analysis to assess Yatsen Holding Ltd 's fair value, click here.
  • Forward PE
  • Forward EV/EBITDA
  • Forward PS

Forward PE

The forward P/E ratio is a valuation metric that divides a company's current stock price by its estimated future earnings per share over the next 12 months.
StronglyUndervaluedUndervaluedFairOvervaluedStronglyOvervalueddotted line Image
N/A
5Y Average PE
-39.85
Current PE
15.68
Overvalued PE
65.75
Undervalued PE
-145.45

Forward EV/EBITDA

The forward EV/EBITDA ratio is a valuation metric that divides a company's enterprise value (EV) by its estimated future earnings before interest, taxes, depreciation, and amortization (EBITDA) over the next 12 months.
StronglyUndervaluedUndervaluedFairOvervaluedStronglyOvervalueddotted line Image
N/A
5Y Average EV/EBITDA
-6.56
Current EV/EBITDA
0.00
Overvalued EV/EBITDA
23.29
Undervalued EV/EBITDA
-36.41

Forward PS

The forward P/S ratio is a valuation metric that divides a company's current stock price by its estimated future sales (or revenue) per share over the next 12 months.
StronglyUndervaluedUndervaluedFairOvervaluedStronglyOvervalueddotted line Image
N/A
5Y Average PS
2.15
Current PS
0.00
Overvalued PS
5.09
Undervalued PS
-0.80
Financial AI Agent
Financial AI Agent

Financials

Annual
Quarterly
N/A
Total Revenue
N/A
Operating Profit
N/A
Net Income after Tax
N/A
EPS - Diluted
N/A
Free Cash Flow
N/A
Gross Profit Margin - %
N/A
FCF Margin - %
N/A
Net Margin - %

Trading Trends

  • Insider
  • Hedge Fund
  • Congress Trading
Insider
Insiders are Neutral. There are no significant trading trends over the last month.
Sold
Bought
Hedge Fund
Hedge Funds are Neutral. There are no significant trading trends over the last quarter.
Sold
Bought
Congress Trading
Congress are Neutral. There are no significant trading trends over the last month.
Sold
Bought
Insider
Insiders are Neutral. There are no significant trading trends over the last month.
Sold
Bought
AI Stock Picker
AI Stock Picker

YSG News & Events

Events Timeline

(ET)
2025-11-17
05:08:05
Yatsen Projects 15%-30% Revenue Growth in Q4
select
2025-11-17
05:07:12
Yatsen Announces Q3 Earnings Per Share of 7 Cents Compared to 11 Cents Last Year
select
2025-06-26 (ET)
2025-06-26
12:01:33
Yatsen falls -6.0%
select
Sign Up For More Events

News

[object Object]
Preview
4.5
11-18Benzinga
Nasdaq Rises as New York Manufacturing Activity Soars in November
  • U.S. Stock Market Performance: U.S. stocks showed mixed results, with the Nasdaq Composite gaining over 50 points, while the Dow dipped slightly by 0.03%. The S&P 500 also saw a modest increase of 0.13%.

  • Sector Movements: Communication services stocks rose by 2.2%, while energy stocks fell by 0.8%. Notable stock movements included Sigma Lithium Corp surging 32% and Autonomix Medical, Inc. rising 50%.

  • Economic Indicators: The NY Empire State Manufacturing Index increased to 18.70 points in November, surpassing October's reading of 10.70 and market expectations of 6. Additionally, U.S. construction spending rose by 0.2% month-over-month in August.

  • Global Market Trends: European shares declined, with the eurozone's STOXX 600 falling 0.52%, and Asian markets mostly closed lower, highlighted by Japan's Nikkei 225 dropping 0.10%.

[object Object]
Preview
9.5
11-17PRnewswire
Yatsen Announces Third Quarter 2025 Financial Results
  • Financial Performance: Yatsen Holding Limited reported a 47.5% increase in total net revenues for Q3 2025, reaching RMB998.4 million (US$140.2 million), driven by an 83.2% rise in revenues from skincare brands.

  • Gross Margin Improvement: The company's gross margin improved to 78.2% from 75.9% year-over-year, while net loss narrowed by 41.9% to RMB70.4 million (US$9.9 million).

  • Operational Efficiency: Despite increased operating expenses, Yatsen managed to reduce its loss margin significantly, indicating improved operational efficiency and cost structure optimization.

  • Future Outlook: For Q4 2025, Yatsen anticipates total net revenues between RMB1.32 billion and RMB1.49 billion, reflecting a year-over-year growth of approximately 15% to 30%.

[object Object]
Preview
3.5
11-13PRnewswire
Yatsen Group Unveils Beauty Innovation Insight, Defining the Next Era of World-Class Beauty Science
  • Yatsen Group's New Report: Yatsen Group has launched the "Yatsen Group Beauty Innovation Insight," marking China's first comprehensive report on beauty innovation, focusing on beauty science, sustainability, and corporate responsibility.

  • Industry Evolution: The report signifies a shift in China's beauty industry from brand storytelling to a focus on scientific leadership, showcasing Yatsen's increasing impact in the global R&D community.

Sign Up For More News

People Also Watch

FAQ

arrow icon

What is Yatsen Holding Ltd (YSG) stock price today?

The current price of YSG is 5.64 USD — it has decreased -2.42 % in the last trading day.

arrow icon

What is Yatsen Holding Ltd (YSG)'s business?

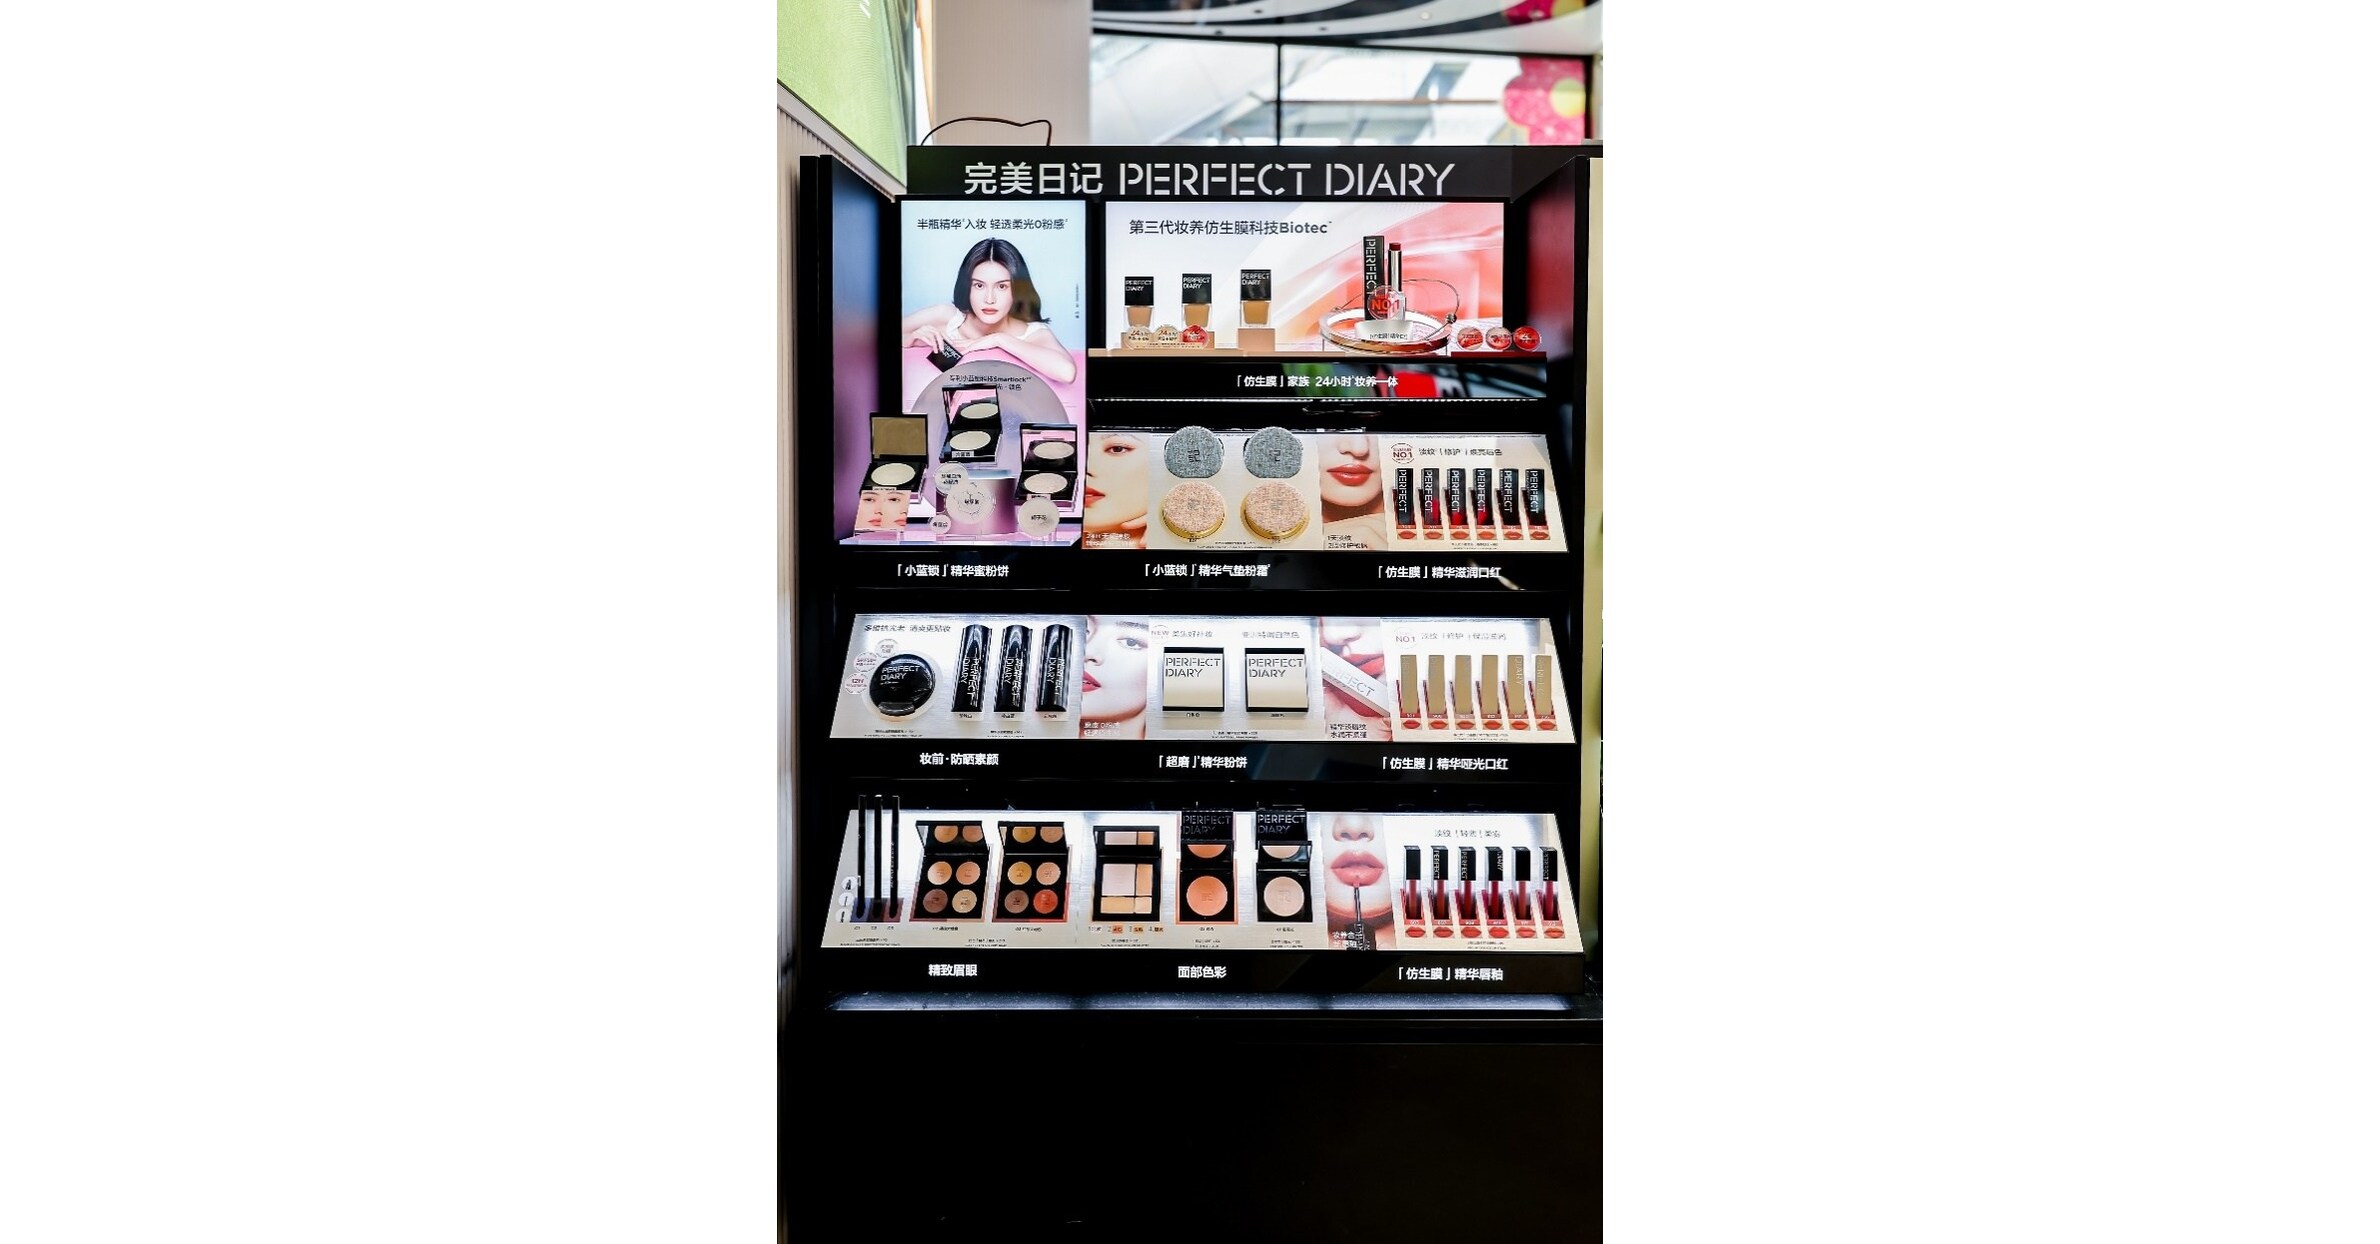
Yatsen Holding Ltd is a holding company primarily engaged in the development, manufacturing and sales of beauty products. The Company operates three segments. The Color Cosmetics Brands segment is primarily engaged in the provision of color cosmetics including lip, eye and face products through the brands such as Perfect Diary, Little Ondine and Pink Bear. The Skincare Brands segment is primarily engaged in the provision of skincare products including face serums, face creams, makeup removers, masks, toners, eye creams and cleansers through the brands such as Galenic, DR.WU, Eve Lom and EANTiM. The Others segment is primarily engaged in the provision of products such as beauty tools and kits, sun screen and beauty devices.

arrow icon

What is the price predicton of YSG Stock?

Wall Street analysts forecast YSG stock price to fall over the next 12 months. According to Wall Street analysts, the average 1-year price target for YSG is  USD with a low forecast of USD and a high forecast of USD. However, analyst price targets are subjective and often lag stock prices, so investors should focus on the objective reasons behind analyst rating changes, which better reflect the company's fundamentals.

arrow icon

What is Yatsen Holding Ltd (YSG)'s revenue for the last quarter?

Yatsen Holding Ltd revenue for the last quarter amounts to 998.42M USD, increased 47.47 % YoY.

arrow icon

What is Yatsen Holding Ltd (YSG)'s earnings per share (EPS) for the last quarter?

Yatsen Holding Ltd. EPS for the last quarter amounts to -0.04 USD, decreased -86.67 % YoY.

arrow icon

What changes have occurred in the market's expectations for Yatsen Holding Ltd (YSG)'s fundamentals?

The market is revising No Change the revenue expectations for Yatsen Holding Limited (YSG) for FY2025, with the revenue forecasts being adjusted by 0% over the past three months. During the same period, the stock price has changed by -39.94%.
arrow icon

How many employees does Yatsen Holding Ltd (YSG). have?

Yatsen Holding Ltd (YSG) has 1350 emplpoyees as of December 05 2025.

arrow icon

What is Yatsen Holding Ltd (YSG) market cap?

Today YSG has the market capitalization of 530.18M USD.

Intellectia LogoIntellectiaIntellectia LogoIntellectia

Redefine Your Investment Decisions

TwitterTwitterYoutubeYoutubeQuoraQuoraDiscordDiscordLinkedinLinkedinTelegramTelegram
AppStoreGooglePlay

Copyright © 2025 Intellectia.AI. All Rights Reserved.

pci certified logo
Company
HomeContactAbout UsNews Release
Compare
TradingViewSeeking Alpha
Features
Financial AI AgentStock Technical AnalysisStock MonitorHedge Fund TrackerAI ScreenerDaytrading Center
Strategies
AI Stock PickerSwing TradingStock Chart PatternsEarnings TradingDaytrading CenterAI Earnings PredictionQuant AIWhales Auto TrackerBacktesting Playground
Free Tools
Dividend CalculatorDividend Yield CalculatorOptions Profit Calculator
Resource
BlogTutorialEarningsTrending StocksCrypto MarketPartner ProgramTerms of UsePrivacy PolicySecuritySitemap
Start for Free