

PAGE NOT FOUND
Oops! It seems the page you are looking for does not exist...
Back to HomepageBlog
Get What You Are Looking For Here
Financial Analysis
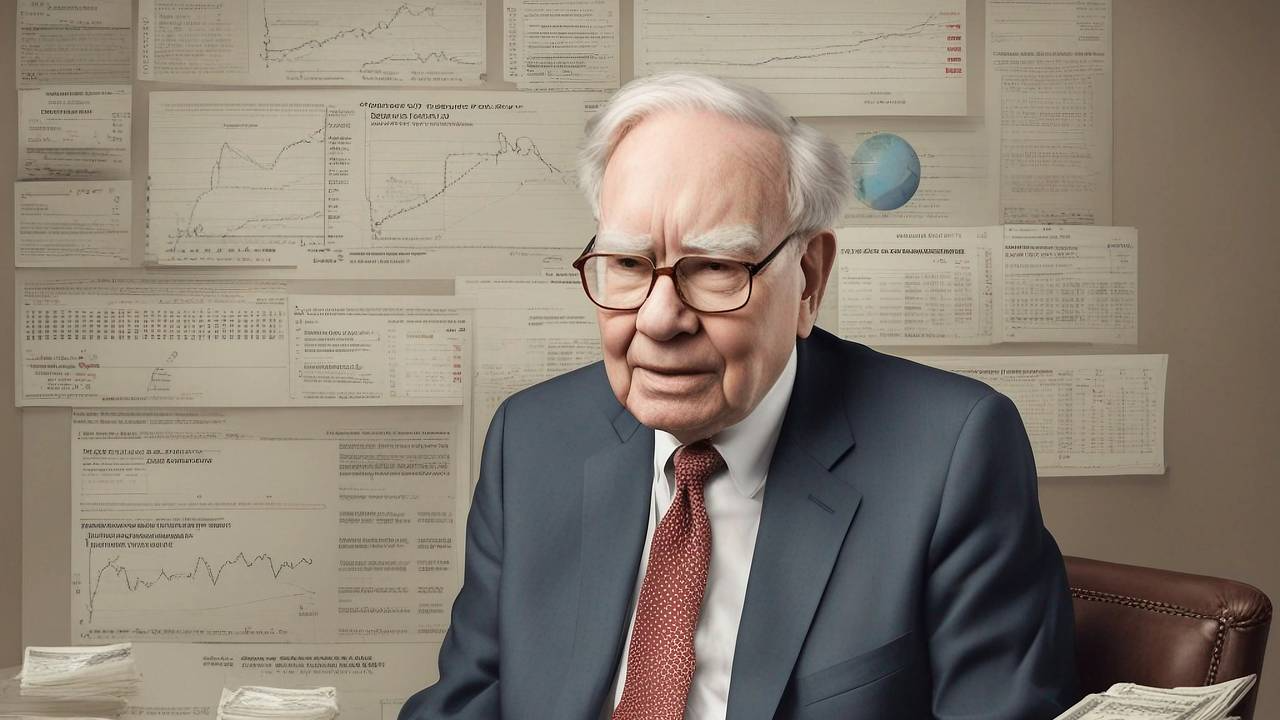
What is in Warren Buffett’s Portfolio
Jason Huang1 days ago
Financial Analysis
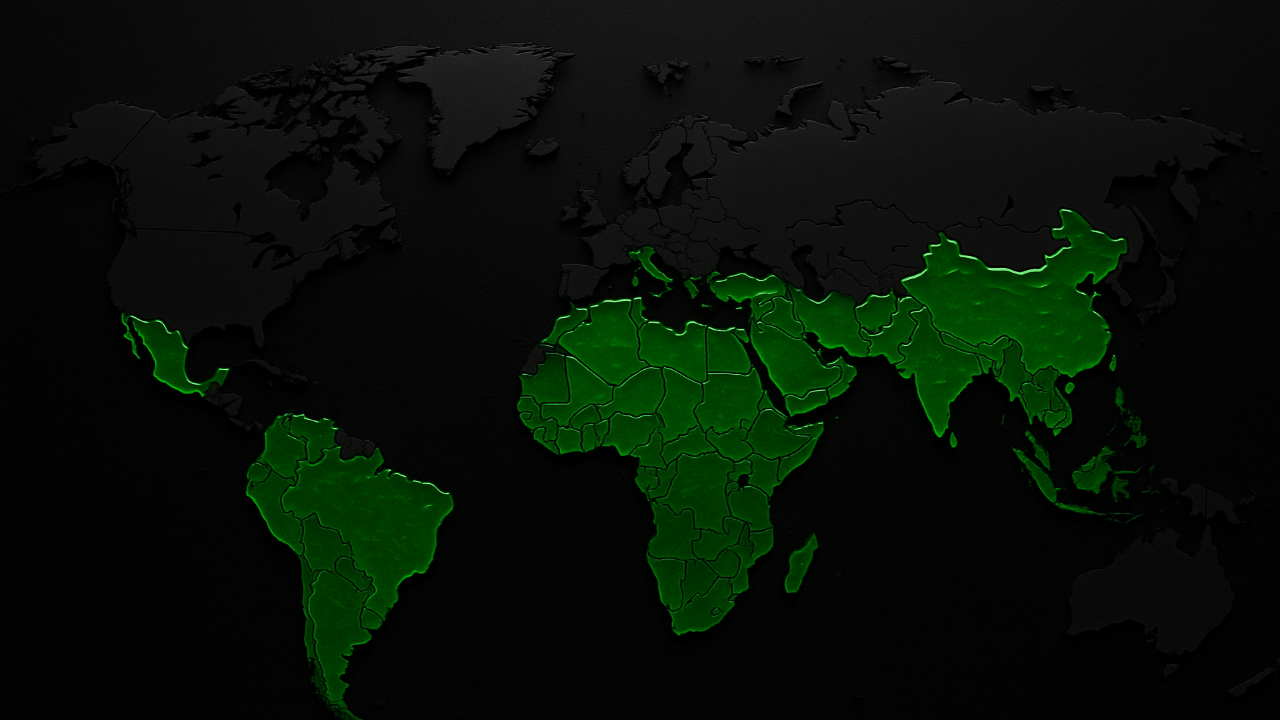
Best Emerging Markets ETFs for 2025: Unlock Global Growth Opportunities
Jason Huang8 days ago
Financial Analysis
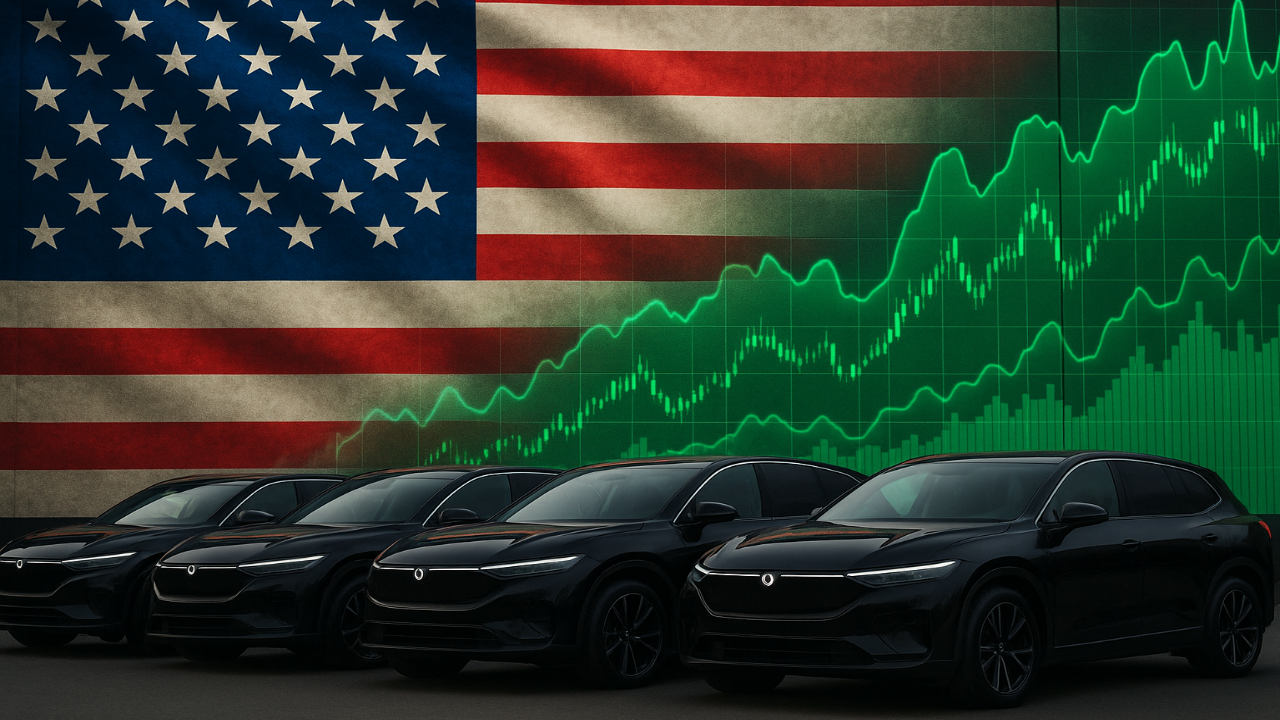
Top Electric Vehicle Stocks to Power Your Portfolio in 2025
Jason Huang21 days ago

Educational Resources
Quantitative Trading with AI: Smarter Strategies for 2025
Jason Huang26 days ago
People Also Watch

WEC
WEC Energy Group Inc
109.86USD
-0.24%

FCEL
Fuelcell Energy Inc
9.6USD
14.83%

UNTY
Unity Bancorp Inc
51.36USD
-0.17%

SHIM
Shimmick Corp
2.81USD
0.00%

ATHA
Athira Pharma Inc
3.86USD
-0.26%
ADAG
Adagene Inc
2.01USD
-1.95%
ACVA
ACV Auctions Inc
10.33USD
-0.67%

KN
Knowles Corp
22.86USD
1.20%
SOC
Sable Offshore Corp
23.58USD
0.08%

CW
Curtiss-Wright Corp
518.13USD
0.66%