
SAM
Boston Beer Company Inc
- Overview
- Forecast
- Valuation
- Earnings

Line
|

Candle
1D
5D
1M
3M
6M
YTD
1Y
5Y
High
223.330
Open
218.190
VWAP
221.10
Vol
287.63K
Mkt Cap
2.41B
Low
218.135
Amount
63.59M
EV/EBITDA(TTM)
7.98
Total Shares
11.95M
EV
2.19B
EV/OCF(TTM)
7.67
P/S(TTM)
1.23
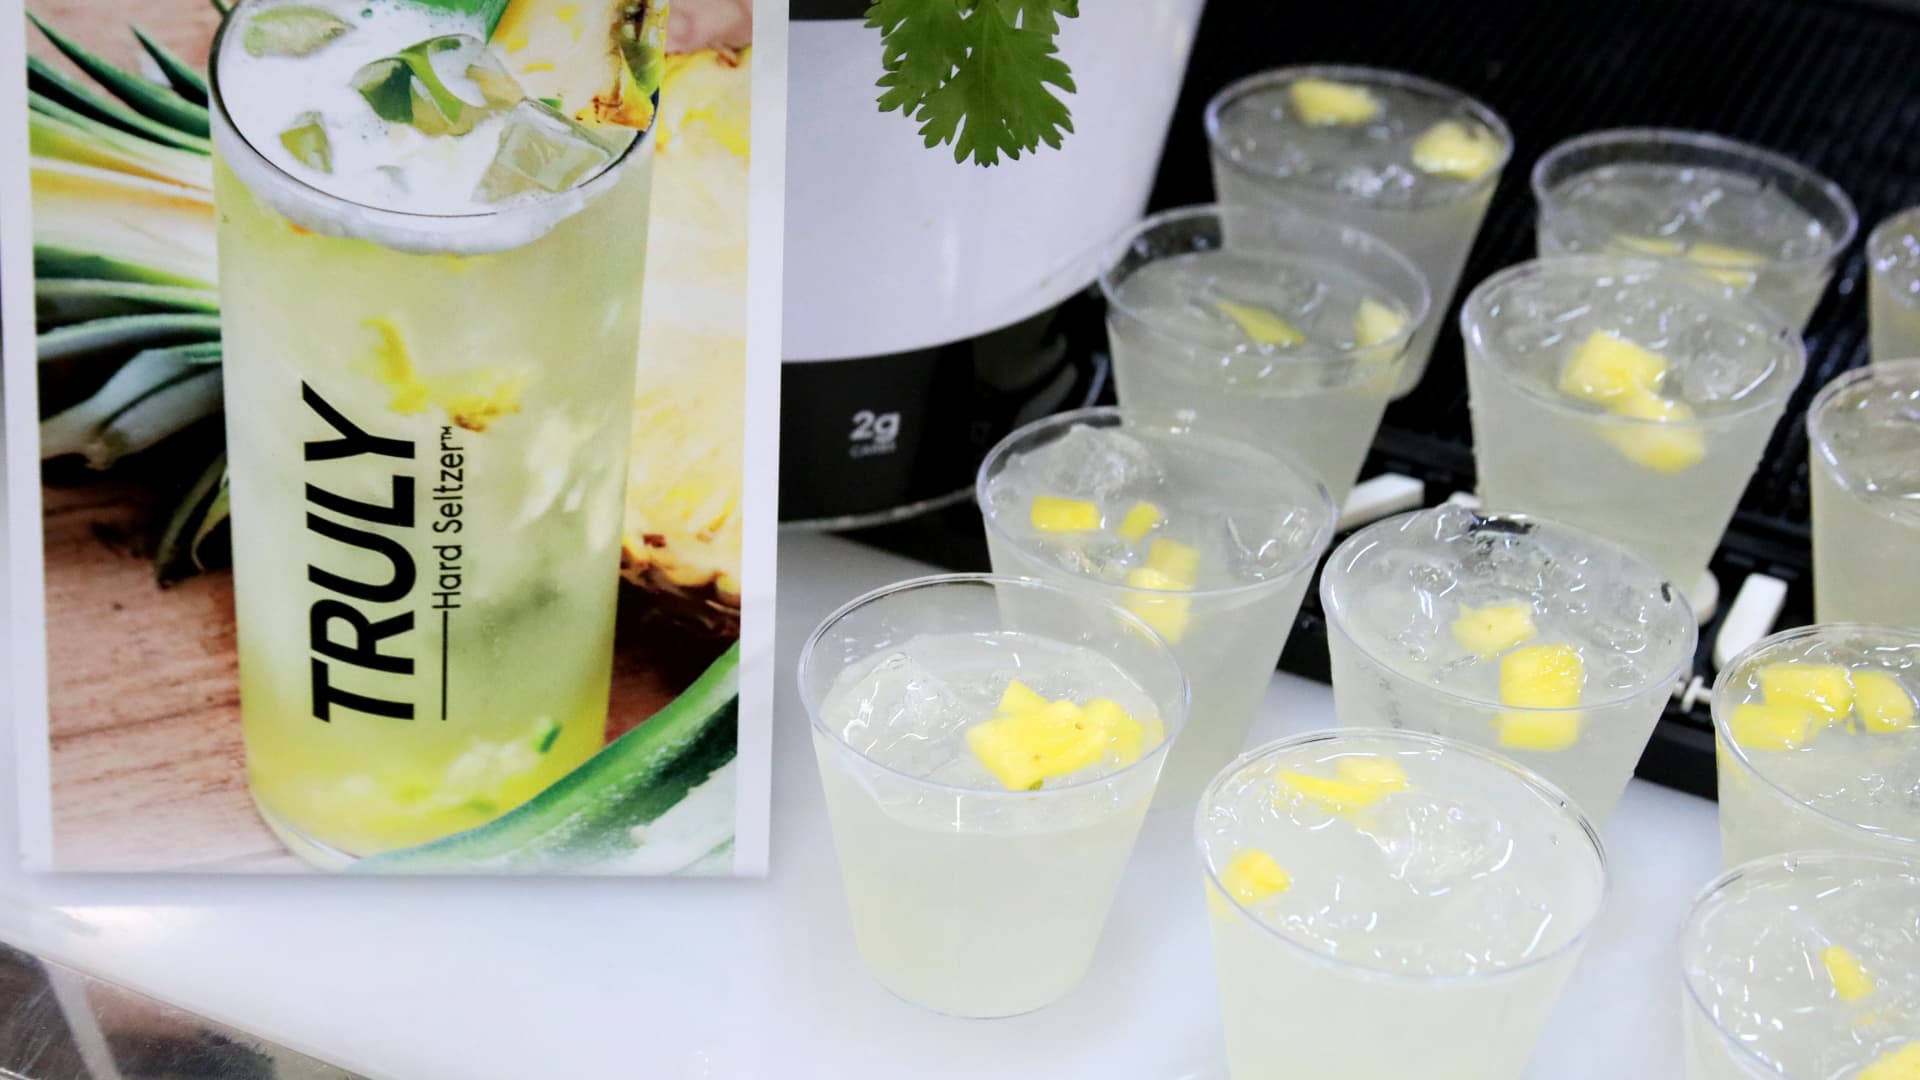
The Boston Beer Company, Inc. is engaged in the business of selling alcohol beverages throughout the United States and in selected international markets, under various trademarks. The trademarks include The Boston Beer Company, Twisted Tea Brewing Company, Hard Seltzer Beverage Company, Angry Orchard Cider Company, Dogfish Head Craft Brewery, Dogfish Head Distilling Co., Angel City Brewing Company, Coney Island Brewing Company, Green Rebel Brewing Co., and Sun Cruiser Beverage Co. It produces alcohol beverages, including hard seltzer, flavored malt beverages, and hard cider at Company-owned breweries and its cidery and under contract arrangements at other production facilities. The four primary Company-owned breweries are focused on production and research and development. It also owns three smaller local breweries that are mainly focused on brewing and packaging beers for retail sales on site at tap rooms and gift shops, and other. The Company sells its beverages in various packages.
Show More
Market Estimates
Earnings Estimates
Revenue
YoY Chg
EPS
YoYChg
FY2026Q1
FY2025Q4
FY2025Q3
446.86M
-1.54%
2.193
+1.55%
381.71M
-5.12%
-2.018
+20.12%
542.97M
-10.32%
3.342
-37.69%
Estimates Revision
The market is revising Downward the revenue expectations for The Boston Beer Company, Inc. (SAM) for FY2025, with the revenue forecasts being adjusted by -3.88% over the past three months. During the same period, the stock price has changed by 0.09%.
Revenue Estimates for FY2025
Revise Downward

-3.88%
In Past 3 Month
EPS Estimates for FY2025
Revise Downward

-2.33%
In Past 3 Month
Stock Price
Go Up

+0.09%
In Past 3 Month
13 Analyst Rating

8.71% Upside
Wall Street analysts forecast SAM stock price to rise over the next 12 months. According to Wall Street analysts, the average 1-year price target for SAM is 240.34 USD with a low forecast of 187.00 USD and a high forecast of 326.00 USD. However, analyst price targets are subjective and often lag stock prices, so investors should focus on the objective reasons behind analyst rating changes, which better reflect the company's fundamentals.
3 Buy
9 Hold
1 Sell
Hold

8.71% Upside
Current: 221.090

Low
187.00
Averages
240.34
High
326.00

8.71% Upside
Current: 221.090

Low
187.00
Averages
240.34
High
326.00
Roth Capital
Bill Kirk
Buy
downgrade
$328 -> $326
2025-07-25
Reason
Roth Capital
Bill Kirk
Price Target
$328 -> $326
2025-07-25
downgrade
Buy
Reason
Roth Capital analyst Bill Kirk lowered the firm's price target on Boston Beer to $326 from $328 and keeps a Buy rating on the shares. Despite in-line revenues, Boston Beer reported strong Q2 earnings, and while depletion and EPS guidance ranges introduce some pretty draconian scenarios, those outcomes are "very unlikely," the analyst tells investors in a research note.
Morgan Stanley
Equal Weight
maintain
$270 -> $245
2025-07-25
Reason
Morgan Stanley
Price Target
$270 -> $245
2025-07-25
maintain
Equal Weight
Reason
Morgan Stanley lowered the firm's price target on Boston Beer to $245 from $270 and keeps an Equal Weight rating on the shares after the company reported a large Q2 EPS beat and reiterated FY25 EPS guidance, excluding tariffs. While the firm is raising its FY25 EPS forecast by 4% to reflect the Q2 upside and higher gross margins, its FY26 EPS estimates remain largely unchanged and it expects continued headwinds for the Twisted Tea brand, adding that is lowering its price target to reflect multiple compression in the alcohol space.
Evercore ISI
In Line
downgrade
$275 -> $250
2025-07-25
Reason
Evercore ISI
Price Target
$275 -> $250
2025-07-25
downgrade
In Line
Reason
Evercore ISI lowered the firm's price target on Boston Beer to $250 from $275 and keeps an In Line rating on the shares. Q2 performance was "better-than-feared," with sales aligning with expectations and EPS surpassing forecasts as the company achieved "notable" gross margin improvement, driven by brewery efficiencies and strategic pricing, the analyst tells investors. The "battleground" for Boston Beer remains its ability to navigate macroeconomic pressures and revitalize core brands like Twisted Tea and Truly in the face of evolving consumer preferences, the analyst added.
UBS
Neutral
downgrade
$275 -> $214
2025-07-17
Reason
UBS
Price Target
$275 -> $214
2025-07-17
downgrade
Neutral
Reason
UBS lowered the firm's price target on Boston Beer to $214 from $275 and keeps a Neutral rating on the shares.
Citi
Buy
downgrade
$285 -> $230
2025-07-15
Reason
Citi
Price Target
$285 -> $230
2025-07-15
downgrade
Buy
Reason
Citi lowered the firm's price target on Boston Beer to $230 from $285 and keeps a Buy rating on the shares. The firm adjusted price targets in the beverages, household and personal care group as part of a Q2 preview. It sees a slightly improved fundamentals across the sector heading into the reports relative to Q1.
Bernstein
Market Perform
downgrade
$270 -> $230
2025-07-09
Reason
Bernstein
Price Target
$270 -> $230
2025-07-09
downgrade
Market Perform
Reason
Bernstein lowered the firm's price target on Boston Beer to $230 from $270 and keeps a Market Perform rating on the shares. The firm notes that the structural vs. cyclical debate rages on. Consumers have continued to feel macro pressure and uncertainty, spreading to some other consumer sectors. Liberation Day and tariff uncertainty have continued to act as overhangs for many names, says Bernstein. While there have been some bright spots, the firm believes 2025 has been the year of "Everything Everywhere All at Once" for the industry.
See All Ratings
Valuation Metrics
The current forward P/E ratio for Boston Beer Company Inc (SAM.N) is 23.45, compared to its 5-year average forward P/E of 113.67. For a more detailed relative valuation and DCF analysis to assess Boston Beer Company Inc 's fair value, click here.
Forward PE
The forward P/E ratio is a valuation metric that divides a company's current stock price by its estimated future earnings per share over the next 12 months.

N/A
5Y Average PE
113.67
Current PE
23.45
Overvalued PE
456.35
Undervalued PE
-229.01
Forward EV/EBITDA
The forward EV/EBITDA ratio is a valuation metric that divides a company's enterprise value (EV) by its estimated future earnings before interest, taxes, depreciation, and amortization (EBITDA) over the next 12 months.

N/A
5Y Average EV/EBITDA
22.40
Current EV/EBITDA
9.64
Overvalued EV/EBITDA
46.37
Undervalued EV/EBITDA
-1.56
Forward PS
The forward P/S ratio is a valuation metric that divides a company's current stock price by its estimated future sales (or revenue) per share over the next 12 months.

Fair
5Y Average PS
2.60
Current PS
1.20
Overvalued PS
4.04
Undervalued PS
1.16
Financials
Annual
Quarterly
FY2025Q2
YoY :
+1.53%
587.95M
Total Revenue
FY2025Q2
YoY :
+17.31%
87.05M
Operating Profit
FY2025Q2
YoY :
+15.46%
60.43M
Net Income after Tax
FY2025Q2
YoY :
+24.15%
5.45
EPS - Diluted
FY2025Q2
YoY :
+48.38%
112.25M
Free Cash Flow
FY2025Q2
YoY :
+8.13%
49.75
Gross Profit Margin - %
FY2025Q2
YoY :
+14.01%
10.82
FCF Margin - %
FY2025Q2
YoY :
+13.72%
10.28
Net Margin - %
FY2025Q2
YoY :
-5.77%
8.17
ROIC
Trading Trends
Insider
Insiders areSelling! The selling amount has increased 603.12% over the last month.
Sold
0-3
Months
131.6K
USD
1
3-6
Months
0.0
USD
0
6-9
Months
18.7K
USD
1
0-12
Months
55.7K
USD
3
Bought
0-3
0
0.0
USD
Months
3-6
0
0.0
USD
Months
6-9
0
0.0
USD
Months
0-12
0
0.0
USD
Months
Hedge Fund
Hedge Funds are Neutral. There are no significant trading trends over the last quarter.
Sold
0-3
Months
0.0
Volume
0
3-6
Months
0.0
Volume
0
6-9
Months
0.0
Volume
0
0-12
Months
0.0
Volume
0
Bought
0-3
0
0.0
Volume
Months
3-6
2
209.2K
Volume
Months
6-9
2
161.3K
Volume
Months
0-12
0
0.0
Volume
Months
Congress Trading
Congress are Neutral. There are no significant trading trends over the last month.
Sold
0-3
Months
0.0
USD
0
3-6
Months
0.0
USD
0
6-9
Months
0.0
USD
0
0-12
Months
0.0
USD
0
Bought
0-3
0
0.0
USD
Months
3-6
0
0.0
USD
Months
6-9
0
0.0
USD
Months
0-12
0
0.0
USD
Months
Insider
Insiders areSelling! The selling amount has increased 603.12% over the last month.
Sold
0-3
Months
131.6K
USD
1
3-6
Months
0.0
USD
0
6-9
Months
18.7K
USD
1
0-12
Months
55.7K
USD
3
Bought
0-3
0
0.0
USD
Months
3-6
0
0.0
USD
Months
6-9
0
0.0
USD
Months
0-12
0
0.0
USD
Months
SAM News & Events
Events Timeline
2025-08-14 (ET)
2025-08-14
06:06:17
U.S. alcohol industry hit by Canada's boycott, WSJ reports


2025-08-01 (ET)
2025-08-01
16:28:42
Boston Beer CEO Spillane steps down to focus on personal matters

2025-07-25 (ET)
2025-07-25
10:00:08
Boston Beer rises 12.9%

Sign Up For More Events
News
5.0
08-27NewsfilterGarnet Hathaway of the Flyers Partners with Dogfish Head Craft Brewery to Introduce Engine 19 IPA for Local First Responder Support
3.0
08-26NASDAQ.COMBreaking Down the Components: MDYV May Have a Value of $93
8.0
08-25TipRanksThe Impact of Health Warnings on the Alcohol Industry
Sign Up For More News
People Also Watch

TGNA
Tegna Inc
21.200
USD
+0.19%

CVBF
CVB Financial Corp
20.130
USD
-0.40%

SFNC
Simmons First National Corp
20.780
USD
-0.53%

RLX
RLX Technology Inc
2.540
USD
+2.83%

INDB
Independent Bank Corp (Massachusetts)
71.510
USD
-0.25%

PRKS
United Parks & Resorts Inc
52.580
USD
+1.98%

CC
Chemours Co
15.400
USD
+2.19%

ZLAB
Zai Lab Ltd
33.100
USD
+2.73%

NSP
Insperity Inc
55.220
USD
+1.53%

IOSP
Innospec Inc
87.590
USD
0.00%
FAQ

What is Boston Beer Company Inc (SAM) stock price today?
The current price of SAM is 221.09 USD — it has increased 2.16 % in the last trading day.

What is Boston Beer Company Inc (SAM)'s business?

What is the price predicton of SAM Stock?

What is Boston Beer Company Inc (SAM)'s revenue for the last quarter?

What is Boston Beer Company Inc (SAM)'s earnings per share (EPS) for the last quarter?

What changes have occurred in the market's expectations for Boston Beer Company Inc (SAM)'s fundamentals?

How many employees does Boston Beer Company Inc (SAM). have?
