
MATX
Matson Inc
- Overview
- Forecast
- Valuation
- Earnings

Line
|

Candle
1D
5D
1M
3M
6M
YTD
1Y
5Y
High
103.020
Open
100.750
VWAP
102.42
Vol
376.84K
Mkt Cap
3.27B
Low
100.510
Amount
38.60M
EV/EBITDA(TTM)
4.10
Total Shares
34.17M
EV
3.54B
EV/OCF(TTM)
5.74
P/S(TTM)
0.98
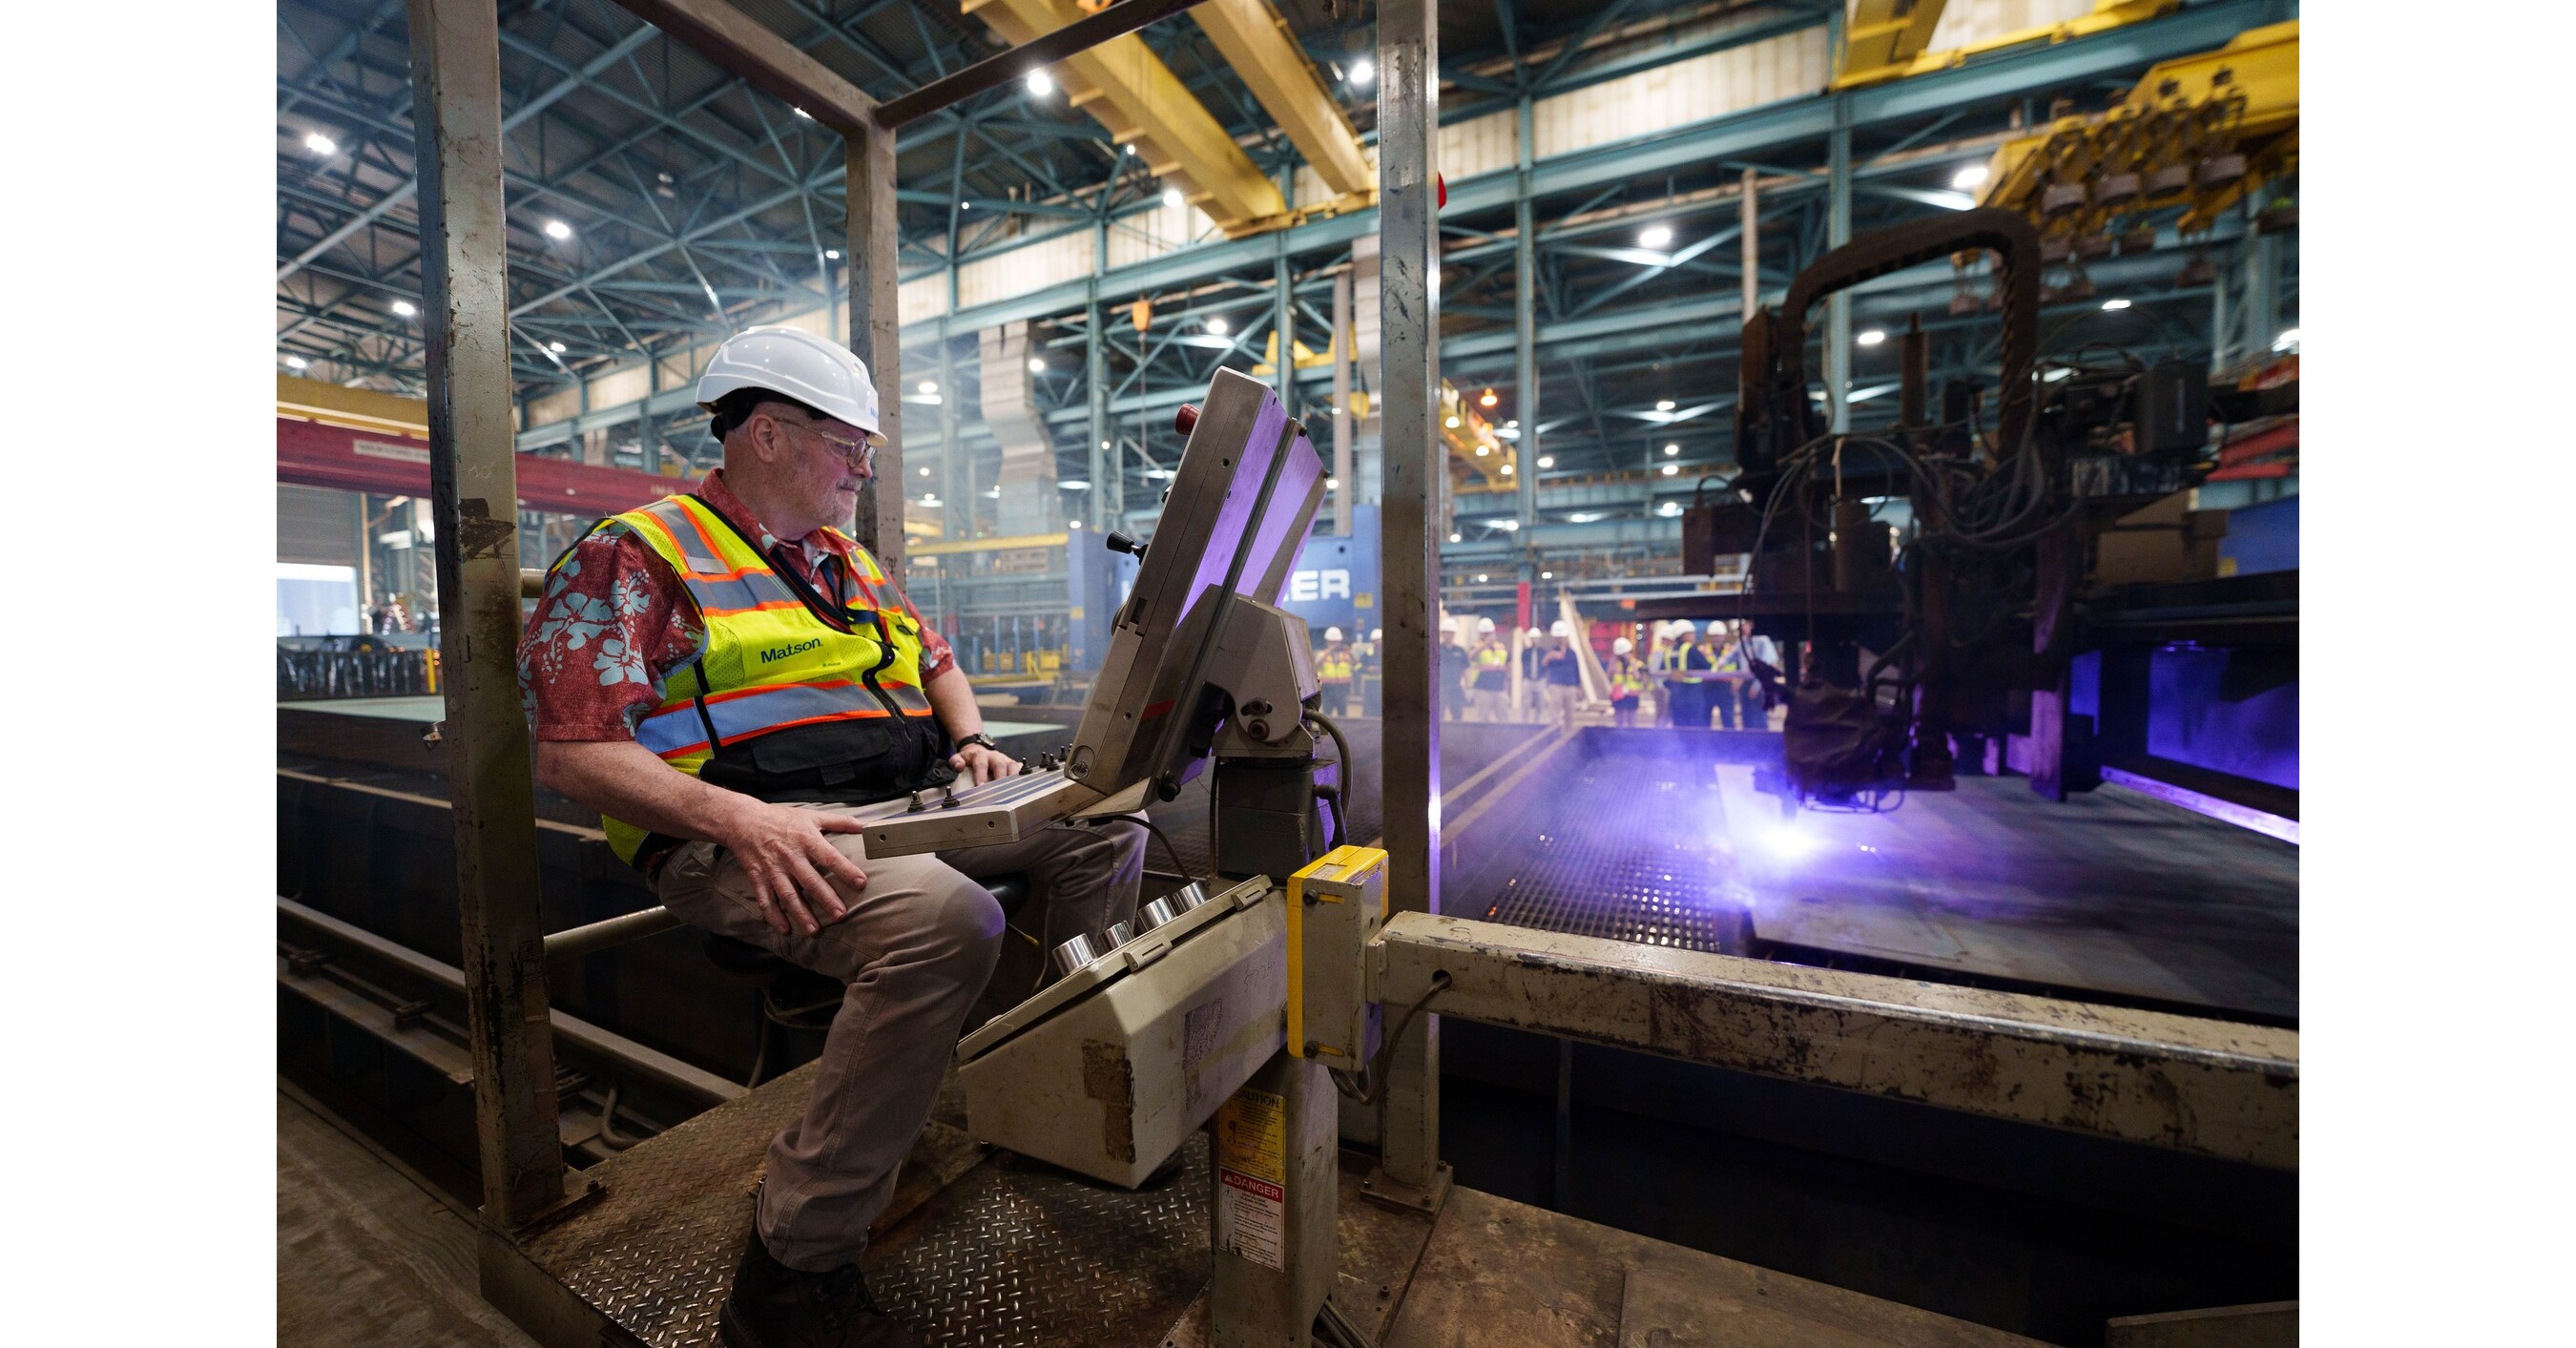
Matson, Inc. is a provider of ocean transportation and logistics services. The Company's segments include Ocean Transportation and Logistics. The Ocean Transportation business is conducted through Matson Navigation Company, Inc. (MatNav), which provides a vital lifeline of ocean freight transportation services to the domestic non-contiguous economies of Hawaii, Alaska and Guam, and to other island economies in Micronesia. MatNav also operates premium, expedited services from China to Long Beach, California, provides services to Okinawa, Japan and various islands in the South Pacific, and operates an international export service from Alaska to Asia. The Logistics business is conducted through Matson Logistics, Inc. (Matson Logistics), a wholly owned subsidiary of MatNav. Matson Logistics provides a variety of logistics services to its customers, such as transportation brokerage services, freight forwarding services, warehousing services and supply chain management services.
Show More
Market Estimates
Earnings Estimates
Revenue
YoY Chg
EPS
YoYChg
FY2026Q1
FY2025Q4
FY2025Q3
746.70M
-4.51%
1.650
-24.31%
791.01M
-11.15%
2.520
-33.68%
827.51M
-13.98%
3.427
-41.82%
Estimates Revision
The market is revising Upward the revenue expectations for Matson, Inc. (MATX) for FY2025, with the revenue forecasts being adjusted by 2.05% over the past three months. During the same period, the stock price has changed by -7.34%.
Revenue Estimates for FY2025
Revise Upward

+2.05%
In Past 3 Month
EPS Estimates for FY2025
Revise Upward

+6.03%
In Past 3 Month
Stock Price
Go Down

-7.34%
In Past 3 Month
2 Analyst Rating
Wall Street analysts forecast MATX stock price to rise over the next 12 months. According to Wall Street analysts, the average 1-year price target for MATX is 115.50 USD with a low forecast of 115.00 USD and a high forecast of 116.00 USD. However, analyst price targets are subjective and often lag stock prices, so investors should focus on the objective reasons behind analyst rating changes, which better reflect the company's fundamentals.
0 Buy
2 Hold
0 Sell
Hold
Current: 102.930

Low
115.00
Averages
115.50
High
116.00
Current: 102.930

Low
115.00
Averages
115.50
High
116.00
Jefferies
Buy -> Hold
downgrade
$135 -> $115
2025-07-18
Reason
Jefferies
Price Target
$135 -> $115
2025-07-18
downgrade
Buy -> Hold
Reason
Jefferies downgraded Matson to Hold from Buy with a price target of $115, down from $135. Freight rates and volumes have softened further in July, the analyst tells investors in a research note. The firm expects Matson to report Q2 results better than expectations but says the company's outlook for Q3 "looks to be softer." Jefferies reduced estimates and downgrade Matson ahead of the earnings print.
Stephens & Co.
Daniel Imbro
Buy
Maintains
$165 → $175
2025-02-26
Reason
Stephens & Co.
Daniel Imbro
Price Target
$165 → $175
2025-02-26
Maintains
Buy
Reason
Stephens raised the firm's price target on Matson to $175 from $165 and keeps an Overweight rating on the shares after the company reported "strong" Q4 results and said it expects that even with the Red Sea situation normalizing by mid-2025, ocean operating income would only be "moderately lower" year-over-year. The firm thinks the setup remains favorable as it expects a secular shift from the airfreight market will continue, the analyst tells investors.
Stifel
Benjamin Nolan
Hold
Maintains
$150 → $160
2025-02-26
Reason
Stifel
Benjamin Nolan
Price Target
$150 → $160
2025-02-26
Maintains
Hold
Reason
Stifel raised the firm's price target on Matson to $160 from $150 and keeps a Hold rating on the shares. Matson reported earnings that were "remarkably strong," driven by higher margins, the analyst tells investors. However, while Matson's China rates are gradually decoupling from broader market rates, the firm expects both international and rates on Matson's China business would decline should containerships normalize movements through the Red Sea, the analyst added.
Stephens & Co.
Daniel Imbro
Buy
Reiterates
$165
2025-01-02
Reason
Stephens & Co.
Daniel Imbro
Price Target
$165
2025-01-02
Reiterates
Buy
Reason
Stephens analysts presented the firm's 2025 Best Ideas list, which includes Valley National (VLY), CoStar Group (CSGP), Castle Biosciences (CSTL), Alignment Healthcare (ALHC), Privia Health (PRVA), Vulcan Materials (VMC), South State (SSB), Matson (MATX), Azenta (AZTA), Prog Holdings (PRG), Carvana (CVNA), Blueprint Medicines (BPMC), Truist Financial (TFC), Cognex (CGNX), Fiserv (FI), Hancock Whitney (HWC), SunOpta (STKL), Wingstop (WING), SM Energy (SM), The Andersons (ANDE) and Bank of Marin (BMRC).
Wolfe Research
Jacob Lacks
Buy
to
Hold
Downgrades
n/a
2024-11-18
Reason
Wolfe Research
Jacob Lacks
Price Target
n/a
2024-11-18
Downgrades
Buy
to
Hold
Reason
Wolfe Research downgraded Matson to Peer Perform from Outperform. The firm cites valuation for the downgrade. Matson has materially outperformed this year, and the stock is now trading in line with historical valuation levels on Wolfe's view of normalized earnings, the analyst tells investors in a research note. The firm also sees potential tariff risk under a Trump administration.
See All Ratings
Valuation Metrics
The current forward P/E ratio for Matson Inc (MATX.N) is 10.04, compared to its 5-year average forward P/E of 8.46. For a more detailed relative valuation and DCF analysis to assess Matson Inc 's fair value, click here.
Forward PE
The forward P/E ratio is a valuation metric that divides a company's current stock price by its estimated future earnings per share over the next 12 months.

Fair
5Y Average PE
8.46
Current PE
10.04
Overvalued PE
11.99
Undervalued PE
4.93
Forward EV/EBITDA
The forward EV/EBITDA ratio is a valuation metric that divides a company's enterprise value (EV) by its estimated future earnings before interest, taxes, depreciation, and amortization (EBITDA) over the next 12 months.

Fair
5Y Average EV/EBITDA
5.90
Current EV/EBITDA
6.83
Overvalued EV/EBITDA
7.92
Undervalued EV/EBITDA
3.87
Forward PS
The forward P/S ratio is a valuation metric that divides a company's current stock price by its estimated future sales (or revenue) per share over the next 12 months.

Fair
5Y Average PS
0.99
Current PS
1.06
Overvalued PS
1.22
Undervalued PS
0.77
Financials
Annual
Quarterly
FY2025Q2
YoY :
-1.99%
830.50M
Total Revenue
FY2025Q2
YoY :
-14.34%
105.70M
Operating Profit
FY2025Q2
YoY :
-16.34%
94.70M
Net Income after Tax
FY2025Q2
YoY :
-11.78%
2.92
EPS - Diluted
FY2025Q2
YoY :
-91.89%
19.30M
Free Cash Flow
FY2025Q2
YoY :
-8.33%
21.69
Gross Profit Margin - %
FY2025Q2
YoY :
-34.48%
7.43
FCF Margin - %
FY2025Q2
YoY :
-14.67%
11.40
Net Margin - %
FY2025Q2
YoY :
+41.00%
17.23
ROIC
Trading Trends
Insider
Insiders are Neutral. There are no significant trading trends over the last month.
Sold
0-3
Months
167.7K
USD
2
3-6
Months
1.8M
USD
5
6-9
Months
0.0
USD
0
0-12
Months
3.9M
USD
9
Bought
0-3
0
0.0
USD
Months
3-6
2
608.0K
USD
Months
6-9
0
0.0
USD
Months
0-12
0
0.0
USD
Months
Hedge Fund
Hedge Funds areBuying! The buying amount has increased 1763.35% over the last quarter.
Sold
0-3
Months
0.0
Volume
0
3-6
Months
0.0
Volume
0
6-9
Months
375.0
Volume
1
0-12
Months
0.0
Volume
0
Bought
0-3
0
0.0
Volume
Months
3-6
1
90.0K
Volume
Months
6-9
2
4.8K
Volume
Months
0-12
0
0.0
Volume
Months
Congress Trading
Congress are Neutral. There are no significant trading trends over the last month.
Sold
0-3
Months
0.0
USD
0
3-6
Months
0.0
USD
0
6-9
Months
0.0
USD
0
0-12
Months
0.0
USD
0
Bought
0-3
0
0.0
USD
Months
3-6
0
0.0
USD
Months
6-9
0
0.0
USD
Months
0-12
0
0.0
USD
Months
Insider
Insiders are Neutral. There are no significant trading trends over the last month.
Sold
0-3
Months
167.7K
USD
2
3-6
Months
1.8M
USD
5
6-9
Months
0.0
USD
0
0-12
Months
3.9M
USD
9
Bought
0-3
0
0.0
USD
Months
3-6
2
608.0K
USD
Months
6-9
0
0.0
USD
Months
0-12
0
0.0
USD
Months
MATX News & Events
Events Timeline
2025-07-31 (ET)
2025-07-31
16:20:08
Matson reports Q2 EPS $2.92 vs. $3.31 last year

2025-07-18 (ET)
2025-07-18
10:00:24
Matson falls -5.4%

2025-06-26 (ET)
2025-06-26
16:11:05
Matson raises quarterly dividend to 36c from 34c per share

Sign Up For More Events
News
8.0
08-05NASDAQ.COMEx-Dividend Reminder: Eaton, Matson and Franklin Electric
3.5
08-04NewsfilterMatson, Hanwha Philly Shipyard Mark "Aloha Class" Ship Construction Milestone with Dock-Mounting Ceremony
9.5
08-04NASDAQ.COMMatson (MATX) Q2 2025 Earnings Call Transcript
Sign Up For More News
People Also Watch

ZG
Zillow Group Inc
77.890
USD
+0.40%

BEPC
Brookfield Renewable Corp
33.390
USD
-0.12%

ALGM
Allegro Microsystems Inc
30.880
USD
+1.31%

AEIS
Advanced Energy Industries Inc
148.070
USD
+0.22%

BRZE
Braze Inc
25.535
USD
+1.21%

PLXS
Plexus Corp
130.550
USD
+1.43%

PRIM
Primoris Services Corp
111.700
USD
+1.01%

GH
Guardant Health Inc
61.280
USD
+4.75%

MSM
MSC Industrial Direct Co Inc
86.910
USD
-0.87%

BOX
Box Inc
31.180
USD
-1.08%
FAQ

What is Matson Inc (MATX) stock price today?
The current price of MATX is 102.93 USD — it has increased 1.24 % in the last trading day.

What is Matson Inc (MATX)'s business?

What is the price predicton of MATX Stock?

What is Matson Inc (MATX)'s revenue for the last quarter?

What is Matson Inc (MATX)'s earnings per share (EPS) for the last quarter?

What changes have occurred in the market's expectations for Matson Inc (MATX)'s fundamentals?

How many employees does Matson Inc (MATX). have?
