IGC Overview
-
$
0.000
0.000(0.000%)
At close0.000(0.000%)Aft-market
ET
Loading chart...


The current price of IGC is 0.2749 USD — it has decreased -0.36
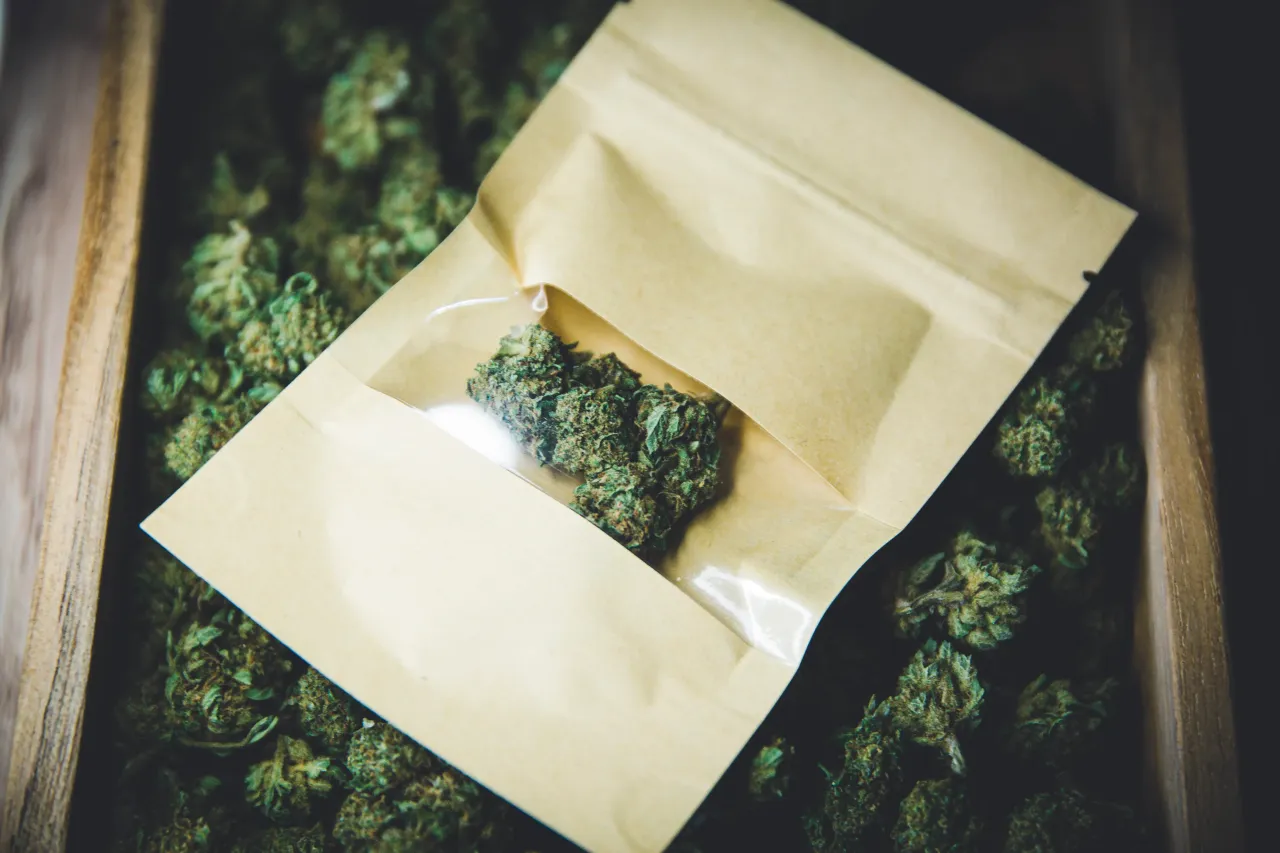
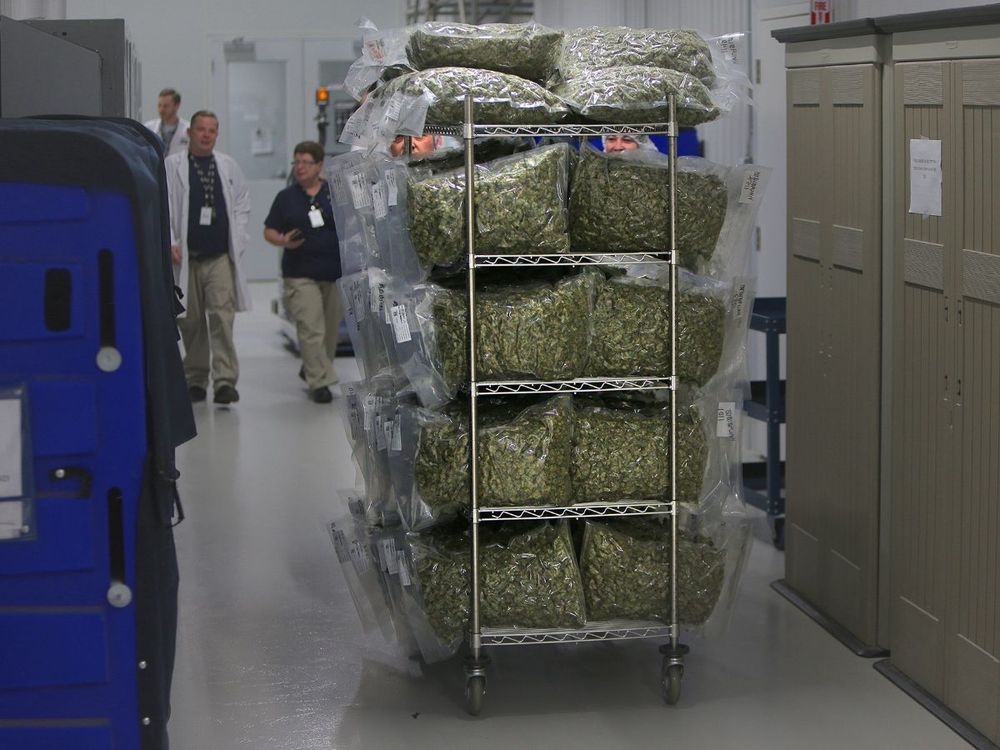
IGC Pharma, Inc. is a clinical-stage biotechnology company leveraging artificial intelligence (AI) to develop treatments for Alzheimer's and metabolic disorders. The Company's lead asset, IGC-AD1, is a cannabinoid-based therapy is in a Phase 2 trial (CALMA) for agitation in Alzheimer's dementia. The Company’s pipeline includes TGR-63, targeting amyloid plaques, and early-stage programs focused on neurodegeneration, tau proteins, and metabolic dysfunctions. The Company integrates AI to accelerate drug discovery, optimize clinical trials, and enhance patient targeting. It is also developing a Multimodal Interpretable Transformer for Alzheimer’s Disease (MINT-AD). MINT-AD leverages diverse data sources, including brain scans, genetics, lifestyle, and cognitive metrics, to produce clinically interpretable risk profiles and forecast decline trajectories.
Wall Street analysts forecast IGC stock price to rise over the next 12 months. According to Wall Street analysts, the average 1-year price target for IGC is4.75 USD with a low forecast of 4.75 USD and a high forecast of 4.75 USD. However, analyst price targets are subjective and often lag stock prices, so investors should focus on the objective reasons behind analyst rating changes, which better reflect the company's fundamentals.
IGC Pharma Inc revenue for the last quarter amounts to 317.00K USD, decreased -9.43
IGC Pharma Inc. EPS for the last quarter amounts to -0.02 USD, increased 100.00
IGC Pharma Inc (IGC) has 70 emplpoyees as of June 21 2026.
Today IGC has the market capitalization of 27.52M USD.