CGBS Overview
-
$
0.000
0.000(0.000%)
At close0.000(0.000%)Aft-market
ET
Loading chart...


The current price of CGBS is 0 USD — it has increased 0
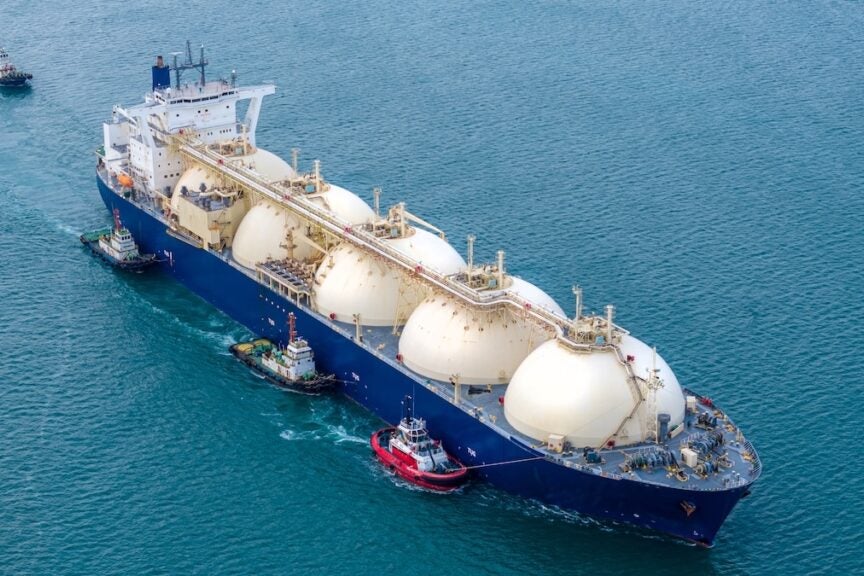
Crown LNG Holdings Limited is a Liquefied Natural Gas (LNG) infrastructure company. The Company is a provider of offshore LNG liquefaction and regasification terminal infrastructure solutions for harsh weather locations which represent an addressable market for bottom-fixed, gravity-based (GBS) liquefaction, and floating storage regasification units, as well as associated green and blue hydrogen, ammonia, and power projects. Through its technologies and design, the Company delivers LNG infrastructure suitable for a range of markets, including markets in harsh weather and energy-isolated locations, as well as providing critical LNG infrastructure to under-served markets around the world. Its project pipeline includes Kakinada regasification terminal, Vung Tau regasification terminal, Grangemouth regasification terminal, and liquefaction terminal in Newfoundland, Canada. The Kakinada project is on the East coast of India. The Grangemouth project is located on the East coast of Scotland.
Wall Street analysts forecast CGBS stock price to fall over the next 12 months. According to Wall Street analysts, the average 1-year price target for CGBS is USD with a low forecast of USD and a high forecast of USD. However, analyst price targets are subjective and often lag stock prices, so investors should focus on the objective reasons behind analyst rating changes, which better reflect the company's fundamentals.
Crown LNG Holdings Ltd revenue for the last quarter amounts to NaN USD, decreased
Crown LNG Holdings Ltd. EPS for the last quarter amounts to USD, decreased
Crown LNG Holdings Ltd (CGBS) has 0 emplpoyees as of May 21 2026.
Today CGBS has the market capitalization of 0.00 USD.