Walmart Approaches $900 Billion Market Cap, Eyes $1 Trillion Valuation
Written by Emily J. Thompson, Senior Investment Analyst
Updated: Jan 06 2026
0mins
Source: Fool
- Market Cap Growth Potential: Walmart's market cap recently reached approximately $900 billion, and a modest 11% stock price increase could push it past the $1 trillion milestone, reflecting strong performance and market confidence in the retail sector.
- Outstanding Stock Performance: Over the past three years, Walmart's stock has surged more than 130%, and despite economic uncertainties, its consistent single-digit growth trend may continue into 2026, bolstering investor confidence.
- Valuation Risk: With a price-to-earnings ratio nearing 40, significantly above the historical average of 30, Walmart's strong business performance may not justify such a high valuation, potentially leading to investor hesitance amid market fluctuations.
- Long-Term Investment Value: Despite facing challenges, Walmart's expansion in advertising and online marketplace positions it as a solid blue-chip stock worth holding long-term, underscoring its leadership and growth potential in the retail industry.
Trade with 70% Backtested Accuracy
Stop guessing "Should I Buy WMT?" and start using high-conviction signals backed by rigorous historical data.
Sign up today to access powerful investing tools and make smarter, data-driven decisions.
Analyst Views on WMT
Wall Street analysts forecast WMT stock price to rise
26 Analyst Rating
25 Buy
1 Hold
0 Sell
Strong Buy
Current: 118.130
Low
119.00
Averages
125.75
High
136.00
Current: 118.130
Low
119.00
Averages
125.75
High
136.00
About WMT
Walmart Inc. is a technology-powered omnichannel retailer. The Company is engaged in the operation of retail and wholesale stores and clubs, as well as eCommerce Websites and mobile applications, located throughout the United States (U.S.), Africa, Canada, Central America, Chile, China, India and Mexico. It operates in three reportable segments: Walmart U.S., Walmart International and Sam's Club U.S. The Walmart U.S. segment includes the Company's mass merchandising concept in the U.S., as well as eCommerce, which includes omni-channel initiatives and certain other business offerings such as advertising services. The Walmart International segment consists of the Company's operations outside of the U.S. through its subsidiaries, as well as eCommerce and omni-channel initiatives. The Sam's Club U.S. segment includes the warehouse membership clubs in the U.S., as well as samsclub.com and omni-channel initiatives.
About the author

Emily J. Thompson
Emily J. Thompson, a Chartered Financial Analyst (CFA) with 12 years in investment research, graduated with honors from the Wharton School. Specializing in industrial and technology stocks, she provides in-depth analysis for Intellectia’s earnings and market brief reports.

Asda Reports Nearly £1 Billion Loss Amid Price Cuts
- Widening Losses: Asda's pretax loss surged to £989 million in 2025 from £599 million in 2024, reflecting significant financial strain due to price-cutting strategies aimed at regaining customers, which could negatively impact future profitability.
- Sales Decline: Total sales, including fuel, fell by 3.4% to £25.9 billion, indicating a loss of customers in a highly competitive market, further exacerbating the company's market share erosion.
- One-Off Costs Impact: The reported loss includes £656 million in one-off costs, primarily £284 million related to the IT separation from Walmart and a £344 million non-cash impairment, highlighting the substantial financial challenges faced during the company's transformation.
- Strong Cash Position: Despite the losses, Asda reported having £1.3 billion in cash and £2.1 billion in total liquidity, demonstrating a strong financial foundation that could support its rebuilding efforts in the future.
See More

Target Commits $2 Billion to Enhance Customer Experience Amid Challenges
- Customer Experience Investment: Target has announced a commitment of over $2 billion over the next few years, including $1 billion specifically aimed at enhancing customer experience, which is intended to improve store environments, inventory management, and operational processes, thereby increasing customer satisfaction and attracting more shoppers.
- Employee Training Enhancement: As of Q1 2026, Target has provided guest experience training to over 300,000 team members, aiming to improve service quality through clear behavioral standards and accountability, with early data indicating improvements in customer satisfaction metrics.
- Market Competition Strategy: In response to pressures from competitors like Walmart, Amazon, and Costco, Target is focusing on enhancing customer experience rather than solely competing on price, demonstrating strategic flexibility in a challenging retail environment.
- Long-Term Profit Potential: Despite the intense competition in the current retail landscape, Target's investment is viewed as a growth investment, expected to drive sales growth and market share increase by improving shopping experiences, reflecting management's confidence in future development.
See More
U.S. Food Companies Navigate Changes to SNAP Policies
- Impact of SNAP Policies: As of May, the USDA has approved food restriction waivers in 23 states affecting about one-third of SNAP participants, with estimates suggesting a potential $830 million drop in food and beverage sales this year, compelling companies to reassess their product lines to adapt to shifting consumer spending.
- Consumer Spending Pressure: Kroger CEO Greg Foran highlighted that customers are under financial pressure due to reduced SNAP benefits and rising gas prices, leading to more cautious shopping behavior, indicating that changes in market demand could significantly influence food companies' sales strategies.
- Legislative Push for Healthy Eating: Iowa has become the first state to codify elements of the
See More

SNAP Restrictions Impact Food Sales
- Sales Decline Forecast: According to Numerator, SNAP purchase restrictions have been approved in 23 states, potentially reducing food and beverage sales by up to $830 million, affecting about one-third of recipients, indicating a direct impact of policy on the food industry.
- Consumer Behavior Shift: Kroger CEO Greg Foran noted that customers are under pressure due to reduced SNAP benefits and rising gas prices, shopping more cautiously, which suggests significant changes in consumer spending patterns that may affect retailers' sales strategies.
- Accelerated Product Reformulation: As the MAHA movement gains traction, food manufacturers are accelerating product reformulations, with many companies pledging to phase out artificial colors by 2027, reflecting the industry's response and adaptation to health trends.
- Increased Market Competition: Major food companies like Hershey and Kraft Heinz are closely monitoring shopper behavior to assess the impact of new policies on their product lines, indicating that businesses need to quickly adjust to maintain market share amid policy changes.
See More
Investment Opportunities Amidst Volatility in Consumer Stocks
- Chipotle Growth Potential: Chipotle Mexican Grill plans to open 350 to 370 new restaurants in 2026, and despite facing sales forecast downgrades and stock price declines, it expects revenue to reach $16.1 billion by 2029, nearly double current levels, demonstrating resilience in its long-term growth trajectory.
- Ulta Sales Growth: Ulta Beauty reported a net sales increase of 11.1% to $3.16 billion in Q1 2026, exceeding analyst expectations, and subsequently raised its annual profit forecast, indicating strong execution capabilities in a competitive beauty market.
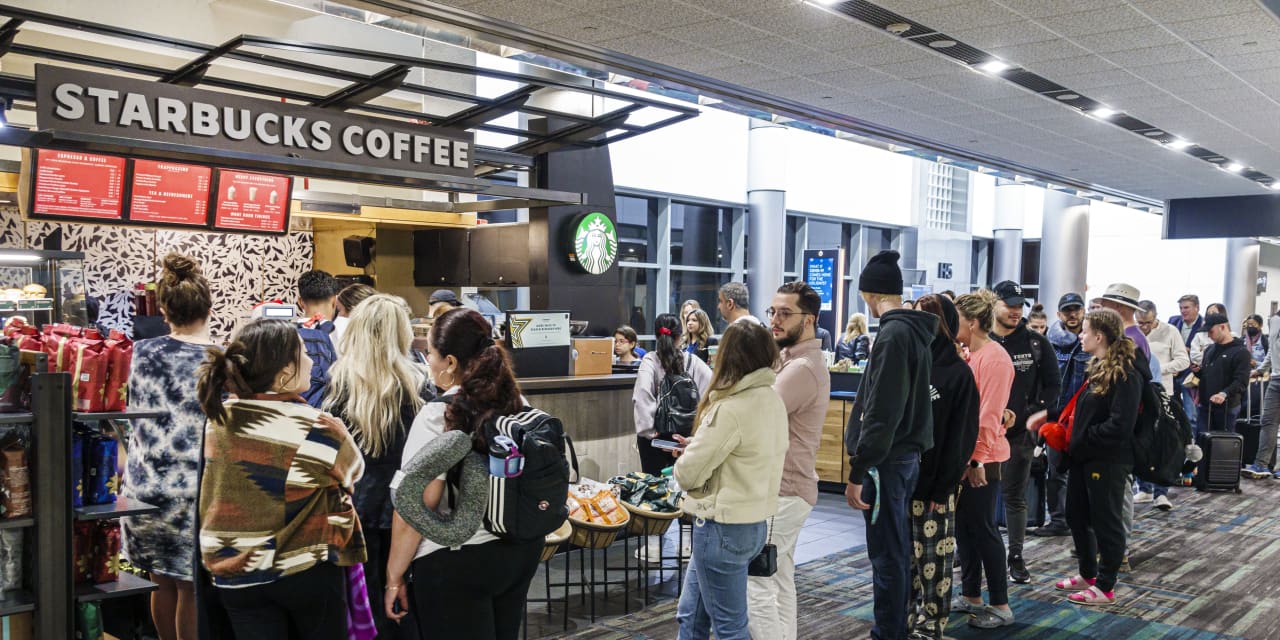
- Dutch Bros Market Advantage: Dutch Bros plans to open at least 181 new shops in 2026, and while the market remains cautious about its valuation, its 30% price increase since 2019 compared to Starbucks' 50% shows a genuine competitive edge in a price-sensitive market.
- Consumer Brand Expansion: Dutch Bros launched at-home coffee products in 2026, marking its transition from a regional drive-thru experience to a national consumer brand, further enhancing its market share and brand recognition.
See More

Restaurant Giants Expand Amid Market Noise
- Chipotle Expansion Plans: Chipotle aims to open 350 to 370 new restaurants in 2026, with international expansion into South Korea, Singapore, and Mexico, projecting revenue of $16.1 billion by 2029, nearly double current levels, indicating strong long-term growth potential.
- Ulta Sales Growth: In Q1 2026, Ulta's net sales rose 11.1% to $3.16 billion, exceeding analyst expectations, driven by the launch of prestige beauty brands, with a forecast of 6% to 7% net sales growth in 2026, showcasing its competitive market position.
- Dutch Bros Market Positioning: Dutch Bros plans to open at least 181 new shops in 2026, with a long-term target of over 7,000 locations, leveraging a 30% price increase compared to Starbucks' 50%, gradually enhancing its market share.
- Consumer Product Expansion: In 2026, Dutch Bros launched at-home coffee products available through Amazon and Walmart, marking its transition from a regional drive-thru experience to a national consumer brand, thereby strengthening its market presence.
See More
Asda Reports Nearly £1 Billion Loss Amid Price Cuts
- Widening Losses: Asda's pretax loss surged to £989 million in 2025 from £599 million in 2024, reflecting significant financial strain due to price-cutting strategies aimed at regaining customers, which could negatively impact future profitability.
- Sales Decline: Total sales, including fuel, fell by 3.4% to £25.9 billion, indicating a loss of customers in a highly competitive market, further exacerbating the company's market share erosion.
- One-Off Costs Impact: The reported loss includes £656 million in one-off costs, primarily £284 million related to the IT separation from Walmart and a £344 million non-cash impairment, highlighting the substantial financial challenges faced during the company's transformation.
- Strong Cash Position: Despite the losses, Asda reported having £1.3 billion in cash and £2.1 billion in total liquidity, demonstrating a strong financial foundation that could support its rebuilding efforts in the future.
See More
Target Commits $2 Billion to Enhance Customer Experience Amid Challenges
- Customer Experience Investment: Target has announced a commitment of over $2 billion over the next few years, including $1 billion specifically aimed at enhancing customer experience, which is intended to improve store environments, inventory management, and operational processes, thereby increasing customer satisfaction and attracting more shoppers.
- Employee Training Enhancement: As of Q1 2026, Target has provided guest experience training to over 300,000 team members, aiming to improve service quality through clear behavioral standards and accountability, with early data indicating improvements in customer satisfaction metrics.
- Market Competition Strategy: In response to pressures from competitors like Walmart, Amazon, and Costco, Target is focusing on enhancing customer experience rather than solely competing on price, demonstrating strategic flexibility in a challenging retail environment.
- Long-Term Profit Potential: Despite the intense competition in the current retail landscape, Target's investment is viewed as a growth investment, expected to drive sales growth and market share increase by improving shopping experiences, reflecting management's confidence in future development.
See More
U.S. Food Companies Navigate Changes to SNAP Policies
- Impact of SNAP Policies: As of May, the USDA has approved food restriction waivers in 23 states affecting about one-third of SNAP participants, with estimates suggesting a potential $830 million drop in food and beverage sales this year, compelling companies to reassess their product lines to adapt to shifting consumer spending.
- Consumer Spending Pressure: Kroger CEO Greg Foran highlighted that customers are under financial pressure due to reduced SNAP benefits and rising gas prices, leading to more cautious shopping behavior, indicating that changes in market demand could significantly influence food companies' sales strategies.
- Legislative Push for Healthy Eating: Iowa has become the first state to codify elements of the
See More
SNAP Restrictions Impact Food Sales
- Sales Decline Forecast: According to Numerator, SNAP purchase restrictions have been approved in 23 states, potentially reducing food and beverage sales by up to $830 million, affecting about one-third of recipients, indicating a direct impact of policy on the food industry.
- Consumer Behavior Shift: Kroger CEO Greg Foran noted that customers are under pressure due to reduced SNAP benefits and rising gas prices, shopping more cautiously, which suggests significant changes in consumer spending patterns that may affect retailers' sales strategies.
- Accelerated Product Reformulation: As the MAHA movement gains traction, food manufacturers are accelerating product reformulations, with many companies pledging to phase out artificial colors by 2027, reflecting the industry's response and adaptation to health trends.
- Increased Market Competition: Major food companies like Hershey and Kraft Heinz are closely monitoring shopper behavior to assess the impact of new policies on their product lines, indicating that businesses need to quickly adjust to maintain market share amid policy changes.
See More
Investment Opportunities Amidst Volatility in Consumer Stocks
- Chipotle Growth Potential: Chipotle Mexican Grill plans to open 350 to 370 new restaurants in 2026, and despite facing sales forecast downgrades and stock price declines, it expects revenue to reach $16.1 billion by 2029, nearly double current levels, demonstrating resilience in its long-term growth trajectory.
- Ulta Sales Growth: Ulta Beauty reported a net sales increase of 11.1% to $3.16 billion in Q1 2026, exceeding analyst expectations, and subsequently raised its annual profit forecast, indicating strong execution capabilities in a competitive beauty market.
- Dutch Bros Market Advantage: Dutch Bros plans to open at least 181 new shops in 2026, and while the market remains cautious about its valuation, its 30% price increase since 2019 compared to Starbucks' 50% shows a genuine competitive edge in a price-sensitive market.
- Consumer Brand Expansion: Dutch Bros launched at-home coffee products in 2026, marking its transition from a regional drive-thru experience to a national consumer brand, further enhancing its market share and brand recognition.
See More
Restaurant Giants Expand Amid Market Noise
- Chipotle Expansion Plans: Chipotle aims to open 350 to 370 new restaurants in 2026, with international expansion into South Korea, Singapore, and Mexico, projecting revenue of $16.1 billion by 2029, nearly double current levels, indicating strong long-term growth potential.
- Ulta Sales Growth: In Q1 2026, Ulta's net sales rose 11.1% to $3.16 billion, exceeding analyst expectations, driven by the launch of prestige beauty brands, with a forecast of 6% to 7% net sales growth in 2026, showcasing its competitive market position.
- Dutch Bros Market Positioning: Dutch Bros plans to open at least 181 new shops in 2026, with a long-term target of over 7,000 locations, leveraging a 30% price increase compared to Starbucks' 50%, gradually enhancing its market share.
- Consumer Product Expansion: In 2026, Dutch Bros launched at-home coffee products available through Amazon and Walmart, marking its transition from a regional drive-thru experience to a national consumer brand, thereby strengthening its market presence.
See More