Analysis of Investment Opportunities in Space Stocks
Written by Emily J. Thompson, Senior Investment Analyst
Updated: 1 hour ago
0mins
Source: seekingalpha
- Significant Market Opportunity: SpaceX's recent IPO claims the space-enabled solutions market is valued at approximately $370 billion, with an additional $1.61 trillion opportunity in broadband and mobile services, highlighting the sector's potential.
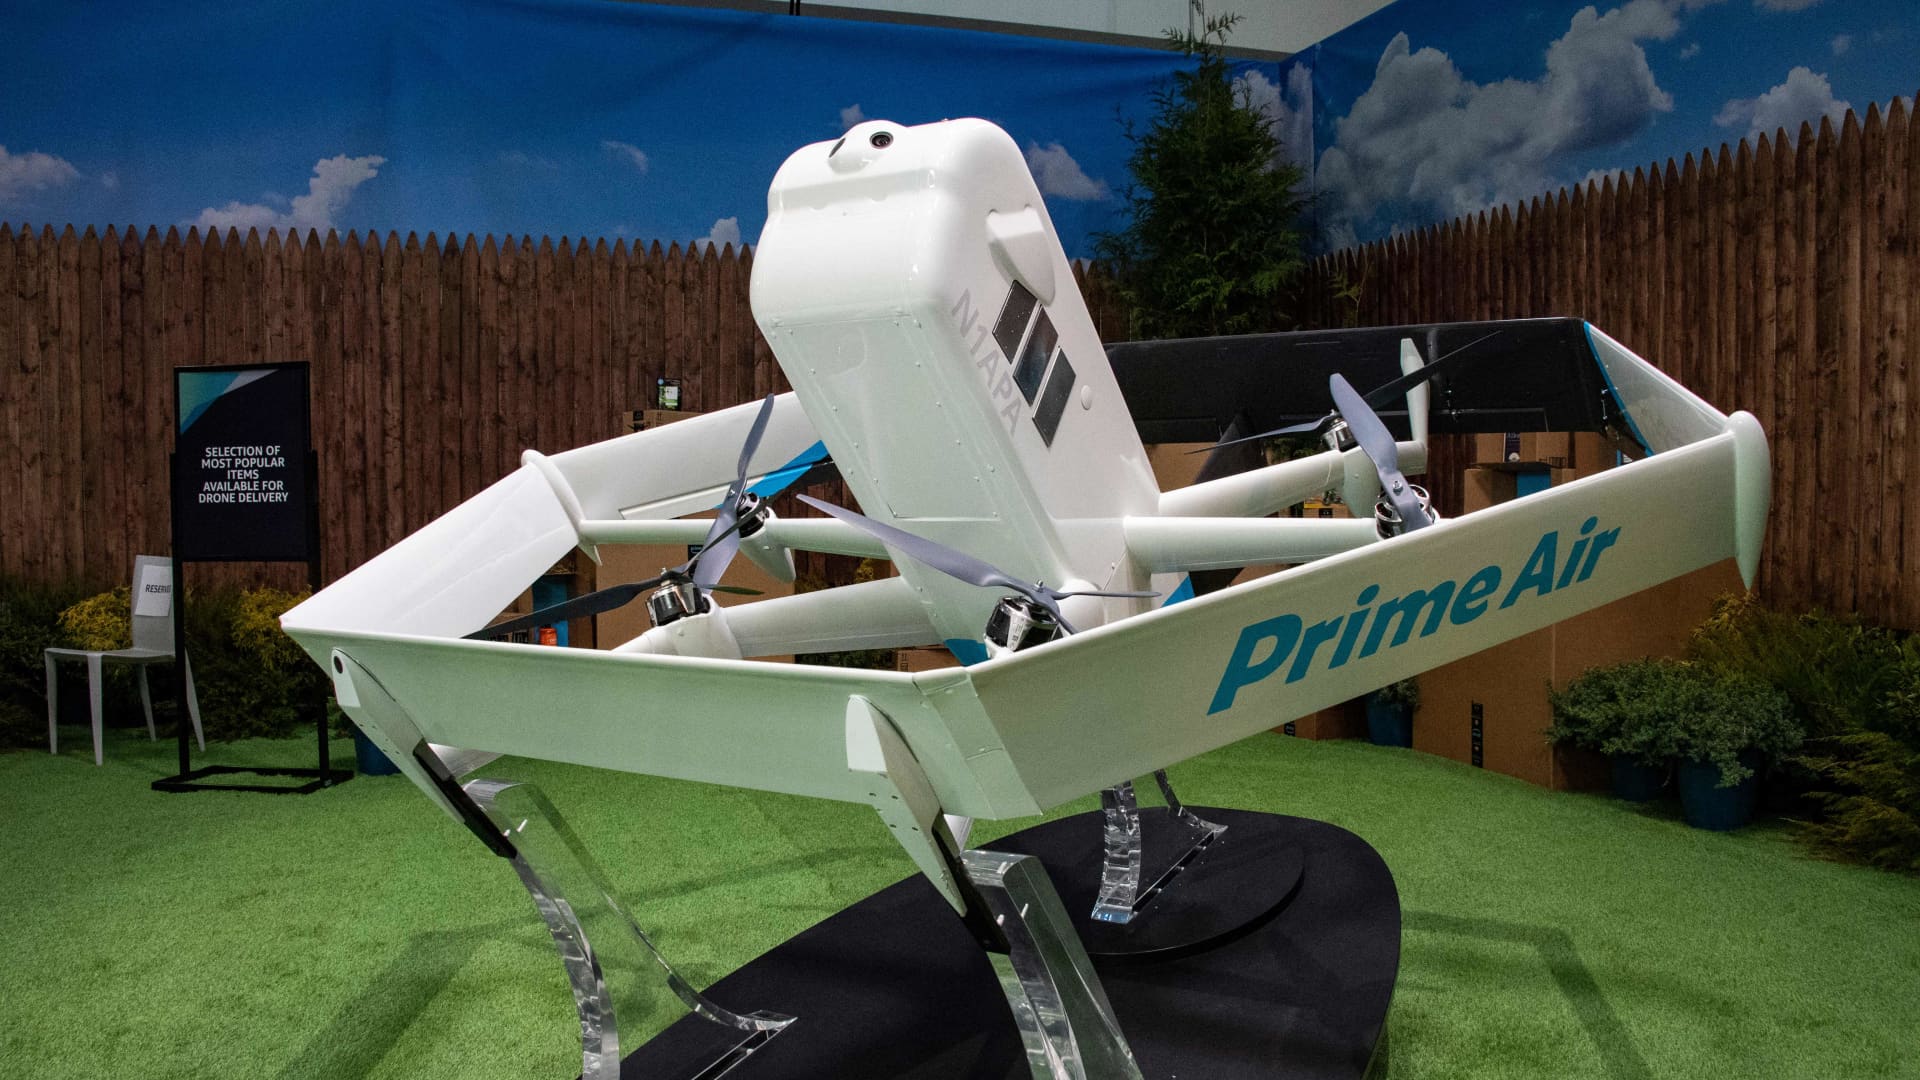
- Amazon's Acquisition Strategy: Amazon announced its acquisition of Globalstar at $90 per share, aiming to enhance its voice, data, and messaging services through the deployment of a D2D satellite system, thereby strengthening its competitive position in the space market.
- Diversified Investment Approach: Analysts recommend that investors focus on multiple niches, such as Earth observation, space surveillance, and defense-adjacent hypersonics, to mitigate risks and capture growth opportunities across different segments.
- Intense Competition Among Small Firms: Among small space companies, Planet Labs and BlackSky compete on data quality and constellation scale, while Rocket Lab stands out in launch and satellite services, underscoring the importance of innovation and market demand in the small-cap sector.
Trade with 70% Backtested Accuracy
Stop guessing "Should I Buy AMZN?" and start using high-conviction signals backed by rigorous historical data.
Sign up today to access powerful investing tools and make smarter, data-driven decisions.
Analyst Views on AMZN
Wall Street analysts forecast AMZN stock price to rise
44 Analyst Rating
41 Buy
3 Hold
0 Sell
Strong Buy
Current: 241.700
Low
175.00
Averages
280.01
High
325.00
Current: 241.700
Low
175.00
Averages
280.01
High
325.00
About AMZN
Amazon.com, Inc. provides a range of products and services to customers. The products offered through its stores include merchandise and content it has purchased for resale and products offered by third-party sellers. The Company’s segments include North America, International and Amazon Web Services (AWS). It serves consumers through its online and physical stores and focuses on selection, price, and convenience. Customers access its offerings through its websites, mobile apps, Alexa, devices, streaming, and physically visiting its stores. It also manufactures and sells electronic devices, including Kindle, Fire tablet, Fire TV, Echo, Ring, Blink, and eero, and develops and produces media content. It serves developers and enterprises of all sizes, including start-ups, government agencies, and academic institutions, through AWS, which offers a set of on-demand technology services, including compute, storage, database, analytics, and machine learning, and other services.
About the author

Emily J. Thompson
Emily J. Thompson, a Chartered Financial Analyst (CFA) with 12 years in investment research, graduated with honors from the Wharton School. Specializing in industrial and technology stocks, she provides in-depth analysis for Intellectia’s earnings and market brief reports.

Amazon's Cloud Services Drive Profit Growth
- Cash Flow Growth: Amazon's operating cash flow reached $148 billion over the past 12 months, demonstrating strong cash generation capabilities that provide ample internal funding for future growth.
- Cloud Business Performance: Amazon Web Services (AWS) achieved a 28% year-over-year growth in Q1, contributing $137 billion in revenue and $48 billion in operating income, making it the company's most profitable segment.
- AI Infrastructure Investment: Amazon's Trainium AI accelerators and Graviton CPUs generate over $20 billion in annual revenue, with increasing enterprise demand for custom chips solidifying Amazon's competitive edge in the AI sector.
- Stock Valuation Attractiveness: Amazon's stock currently trades at about 18 times operating cash flow, down from 32 times at the time of the 2022 stock split, making the investment value significantly more appealing given the company's stronger profitability and cash generation capabilities.
See More

Amazon's Stock Performance and AI Investment Outlook
- Outstanding Stock Performance: Amazon's shares have surged 12,350% since June 2006, meaning a hypothetical $10,000 investment would now exceed $1.2 million, showcasing its strong competitive position in e-commerce and cloud computing.
- Significant Capital Expenditure Increase: The company plans to raise capital expenditures from $131 billion last year to $200 billion in 2026, primarily to support robust customer demand for AWS and generative AI, indicating strong confidence in future growth.
- Dramatic Free Cash Flow Decline: Amazon reported only $1.2 billion in free cash flow over the past 12 months, a notable 95% drop year-over-year, with expectations of a negative $10 billion free cash flow in 2026, reflecting the pressure from high AI investments.
- Rising Debt Levels: Amazon has raised over $80 billion in debt in 2026, and while management remains optimistic about AI investments, the market may demand higher returns, increasing future financial pressures.
See More
Analysis of Investment Opportunities in Space Stocks
- Significant Market Opportunity: SpaceX's recent IPO claims the space-enabled solutions market is valued at approximately $370 billion, with an additional $1.61 trillion opportunity in broadband and mobile services, highlighting the sector's potential.
- Amazon's Acquisition Strategy: Amazon announced its acquisition of Globalstar at $90 per share, aiming to enhance its voice, data, and messaging services through the deployment of a D2D satellite system, thereby strengthening its competitive position in the space market.
- Diversified Investment Approach: Analysts recommend that investors focus on multiple niches, such as Earth observation, space surveillance, and defense-adjacent hypersonics, to mitigate risks and capture growth opportunities across different segments.
- Intense Competition Among Small Firms: Among small space companies, Planet Labs and BlackSky compete on data quality and constellation scale, while Rocket Lab stands out in launch and satellite services, underscoring the importance of innovation and market demand in the small-cap sector.
See More
Analysis of FEPI's Yield Model and Risk Assessment
- Yield Generation Explained: FEPI generates weekly cash distributions of approximately $0.21 by writing short-dated call options on about 15 constituents of the FANG Innovation Index, which translates to an annualized yield of around 25%; however, lower volatility has already diminished weekly payouts from 2024 levels.
- Performance Comparison: Over the past year, FEPI has returned 18%, significantly lagging behind QQQ's 29%, indicating that it has surrendered roughly half of the gains from the tech rally, highlighting the fragility of its yield model.
- Risk Factor Analysis: The sustainability of FEPI's distributions is influenced by both implied volatility and the direction of the underlying assets, with the current VIX near 17, below the 12-month average, suggesting reduced option premiums and potential further declines in future distributions.
- Investor Positioning: While FEPI's distributions are relatively safe, the risk to payout levels and net asset value is significant, making it suitable for investors seeking income who can accept capped upside, whereas directly holding stocks like NVIDIA offers more attractive returns.
See More

CoreWeave Stock Fluctuation Analysis Post-IPO
- IPO Performance: CoreWeave went public at $40 per share on March 28, 2025, reaching a peak of $183.58 by June 20, but has since pulled back to around $82, indicating market caution regarding its future growth prospects.
- Revenue Surge: CoreWeave's revenue skyrocketed from $16 million in 2022 to $5.1 billion in 2025, with projections suggesting annual revenue could hit $40.3 billion by 2028, reflecting a staggering CAGR of 99% in the AI infrastructure sector.
- Debt Concerns: Despite impressive revenue growth, CoreWeave's net loss widened from $31 million in 2022 to $1.2 billion in 2025, with expectations of nearing $2.2 billion by 2028, while total liabilities reached $50.8 billion, resulting in a high debt-to-equity ratio of 10.8, raising financial risk.
- Market Competition: CoreWeave faces intensified market pressure from other neocloud providers and Meta, which has begun selling excess cloud computing capacity, leading to investor concerns about its expansion capabilities despite potential in customer retention and economies of scale.
See More

SpaceX Reaches $2.25 Trillion Valuation Amid Promising Yet Risky Prospects
- Valuation vs. Revenue Gap: SpaceX's market cap ranges between $2.25 trillion and $2.5 trillion, yet its total revenue for 2026 is only $18.7 billion, significantly lower than other trillion-dollar companies, indicating potential overvaluation risks for its stock.
- Revenue Source Breakdown: The company's revenue primarily comes from $4 billion in launch services, $11.4 billion from Starlink satellite internet, and $3.2 billion in AI services; while these segments show growth potential, the overall revenue remains insufficient.
- Competitive Market Pressures: In the satellite internet and AI services sectors, SpaceX faces fierce competition from rivals like Amazon and Rocket Lab, and despite currently holding a dominant position, its future market share could be jeopardized.
- Profitability Challenges: With a gross margin just above 50% and a projected $2.5 billion operating loss in 2025, SpaceX stands as the highest-valued unprofitable company in history, trading at a price-to-sales ratio exceeding 100, reflecting uncertainty about its future profitability.
See More
Amazon's Cloud Services Drive Profit Growth
- Cash Flow Growth: Amazon's operating cash flow reached $148 billion over the past 12 months, demonstrating strong cash generation capabilities that provide ample internal funding for future growth.
- Cloud Business Performance: Amazon Web Services (AWS) achieved a 28% year-over-year growth in Q1, contributing $137 billion in revenue and $48 billion in operating income, making it the company's most profitable segment.
- AI Infrastructure Investment: Amazon's Trainium AI accelerators and Graviton CPUs generate over $20 billion in annual revenue, with increasing enterprise demand for custom chips solidifying Amazon's competitive edge in the AI sector.
- Stock Valuation Attractiveness: Amazon's stock currently trades at about 18 times operating cash flow, down from 32 times at the time of the 2022 stock split, making the investment value significantly more appealing given the company's stronger profitability and cash generation capabilities.
See More
Amazon's Stock Performance and AI Investment Outlook
- Outstanding Stock Performance: Amazon's shares have surged 12,350% since June 2006, meaning a hypothetical $10,000 investment would now exceed $1.2 million, showcasing its strong competitive position in e-commerce and cloud computing.
- Significant Capital Expenditure Increase: The company plans to raise capital expenditures from $131 billion last year to $200 billion in 2026, primarily to support robust customer demand for AWS and generative AI, indicating strong confidence in future growth.
- Dramatic Free Cash Flow Decline: Amazon reported only $1.2 billion in free cash flow over the past 12 months, a notable 95% drop year-over-year, with expectations of a negative $10 billion free cash flow in 2026, reflecting the pressure from high AI investments.
- Rising Debt Levels: Amazon has raised over $80 billion in debt in 2026, and while management remains optimistic about AI investments, the market may demand higher returns, increasing future financial pressures.
See More
Analysis of Investment Opportunities in Space Stocks
- Significant Market Opportunity: SpaceX's recent IPO claims the space-enabled solutions market is valued at approximately $370 billion, with an additional $1.61 trillion opportunity in broadband and mobile services, highlighting the sector's potential.
- Amazon's Acquisition Strategy: Amazon announced its acquisition of Globalstar at $90 per share, aiming to enhance its voice, data, and messaging services through the deployment of a D2D satellite system, thereby strengthening its competitive position in the space market.
- Diversified Investment Approach: Analysts recommend that investors focus on multiple niches, such as Earth observation, space surveillance, and defense-adjacent hypersonics, to mitigate risks and capture growth opportunities across different segments.
- Intense Competition Among Small Firms: Among small space companies, Planet Labs and BlackSky compete on data quality and constellation scale, while Rocket Lab stands out in launch and satellite services, underscoring the importance of innovation and market demand in the small-cap sector.
See More
Analysis of FEPI's Yield Model and Risk Assessment
- Yield Generation Explained: FEPI generates weekly cash distributions of approximately $0.21 by writing short-dated call options on about 15 constituents of the FANG Innovation Index, which translates to an annualized yield of around 25%; however, lower volatility has already diminished weekly payouts from 2024 levels.
- Performance Comparison: Over the past year, FEPI has returned 18%, significantly lagging behind QQQ's 29%, indicating that it has surrendered roughly half of the gains from the tech rally, highlighting the fragility of its yield model.
- Risk Factor Analysis: The sustainability of FEPI's distributions is influenced by both implied volatility and the direction of the underlying assets, with the current VIX near 17, below the 12-month average, suggesting reduced option premiums and potential further declines in future distributions.
- Investor Positioning: While FEPI's distributions are relatively safe, the risk to payout levels and net asset value is significant, making it suitable for investors seeking income who can accept capped upside, whereas directly holding stocks like NVIDIA offers more attractive returns.
See More
CoreWeave Stock Fluctuation Analysis Post-IPO
- IPO Performance: CoreWeave went public at $40 per share on March 28, 2025, reaching a peak of $183.58 by June 20, but has since pulled back to around $82, indicating market caution regarding its future growth prospects.
- Revenue Surge: CoreWeave's revenue skyrocketed from $16 million in 2022 to $5.1 billion in 2025, with projections suggesting annual revenue could hit $40.3 billion by 2028, reflecting a staggering CAGR of 99% in the AI infrastructure sector.
- Debt Concerns: Despite impressive revenue growth, CoreWeave's net loss widened from $31 million in 2022 to $1.2 billion in 2025, with expectations of nearing $2.2 billion by 2028, while total liabilities reached $50.8 billion, resulting in a high debt-to-equity ratio of 10.8, raising financial risk.
- Market Competition: CoreWeave faces intensified market pressure from other neocloud providers and Meta, which has begun selling excess cloud computing capacity, leading to investor concerns about its expansion capabilities despite potential in customer retention and economies of scale.
See More
SpaceX Reaches $2.25 Trillion Valuation Amid Promising Yet Risky Prospects
- Valuation vs. Revenue Gap: SpaceX's market cap ranges between $2.25 trillion and $2.5 trillion, yet its total revenue for 2026 is only $18.7 billion, significantly lower than other trillion-dollar companies, indicating potential overvaluation risks for its stock.
- Revenue Source Breakdown: The company's revenue primarily comes from $4 billion in launch services, $11.4 billion from Starlink satellite internet, and $3.2 billion in AI services; while these segments show growth potential, the overall revenue remains insufficient.
- Competitive Market Pressures: In the satellite internet and AI services sectors, SpaceX faces fierce competition from rivals like Amazon and Rocket Lab, and despite currently holding a dominant position, its future market share could be jeopardized.
- Profitability Challenges: With a gross margin just above 50% and a projected $2.5 billion operating loss in 2025, SpaceX stands as the highest-valued unprofitable company in history, trading at a price-to-sales ratio exceeding 100, reflecting uncertainty about its future profitability.
See More