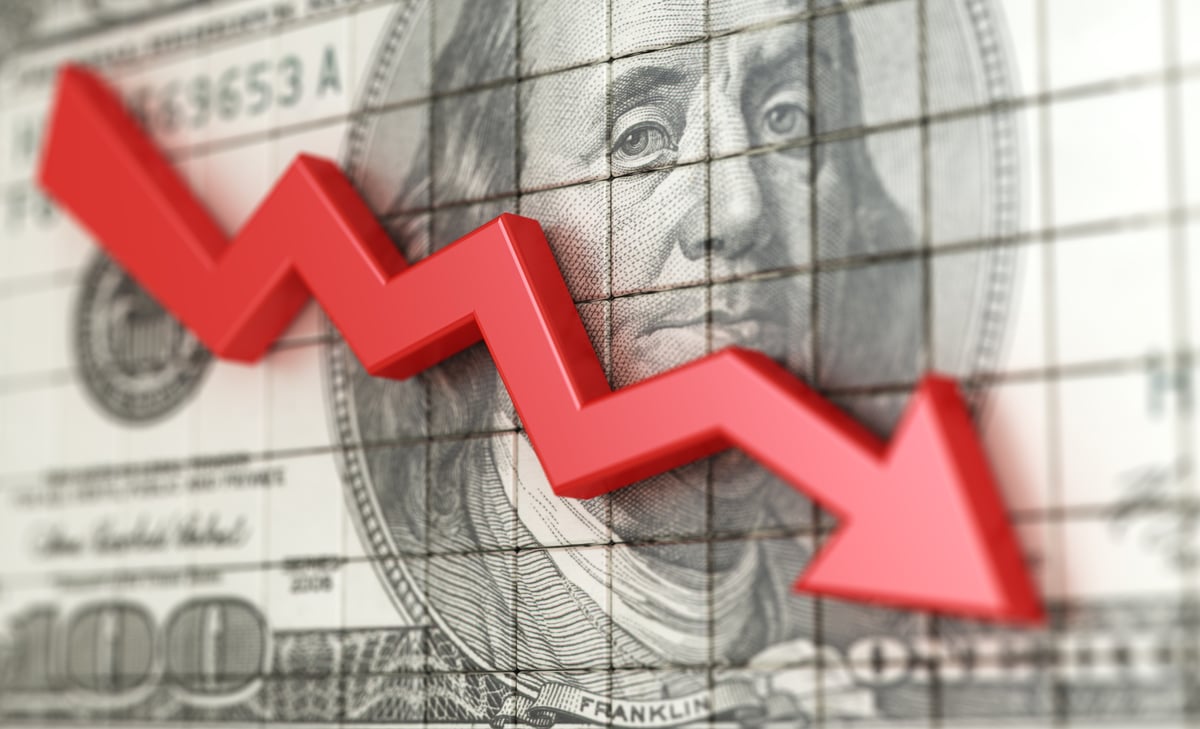
Bitcoin Market Volatility Cools as Options Flows Normalize

- Volatility Decline: According to Glassnode, Bitcoin's implied volatility has fallen below its early February peak, indicating that traders are no longer paying high premiums for protective positions, reflecting a recalibration of market expectations for extreme moves.
- Skew Normalization: The options skew has tightened from approximately 20% to 10%, showing that the demand for downside protection has stabilized; while panic hedging persists, the urgency has diminished, suggesting a shift towards rational market sentiment.
- Changing Trade Flows: Currently, about 54.4% of Bitcoin options trades express a bullish view, while only 21.3% are betting against further upside, indicating a transition from emotional capitulation to calculated risk positioning in the market.
- Structural Bull Market: Although Bitcoin and the broader crypto market traded lower on the day, the options market signals that this is not a panic akin to March 2020, but rather a volatility compression phase within an ongoing structural bull market, with participants showing increased patience towards downside risks.
Get Real-Time Alerts for Any Crypto Movement
Technical Analysis for BTC
Technical Sentiment Analysis for Bitcoin (BTC). As of , Bitcoin (BTC) is exhibiting a Neutral technical sentiment. Our proprietary analysis, which aggregates 3 technical signals, shows that 1 indicators are flashing buy, while 2 are indicating sell.
Momentum Indicators: RSI, MACD & Overbought/Oversold Status. Currently, the Relative Strength Index (RSI) for BTC stands at -, which suggests a Neutral condition. Meanwhile, the MACD (12, 26) indicator is at -, providing a Neutral signal for short-term momentum. Other oscillators like the Stochastic Oscillator at - and the Commodity Channel Index (CCI) at - further confirm a - outlook for the crypto.
Support, Resistance & Moving Averages. From a structural perspective, BTC is trading below its 60-day moving average of $- and below its 200-day long-term moving average of $-. Key price levels to watch include the immediate resistance at $- and strong support at $-. A break above $- could signal a bull continuation, while falling below $- may test the next Fibonacci floor at $-.
Bitcoin (BTC) Support & Resistance Level
| Name | S3 | S2 | S1 | Pivot Points | R1 | R2 | R3 |
|---|---|---|---|---|---|---|---|
| Classic | 51785.893 | 57407.947 | 62805.893 | 68427.947 | 73825.893 | 79447.947 | 84845.893 |
| Fibonacci | 57407.947 | 61617.587 | 64218.307 | 68427.947 | 72637.587 | 75238.307 | 79447.947 |
About BTC
About the author