We are excited to roll out a major update to our Technical Analysis suite! Our goal is to move beyond simple price charts and provide you with a comprehensive, "at-a-glance" health check for any stock.
Whether you are a day trader looking for momentum or a long-term investor seeking entry points, these new tools are designed to streamline your research process.
🚀 Key Enhancements
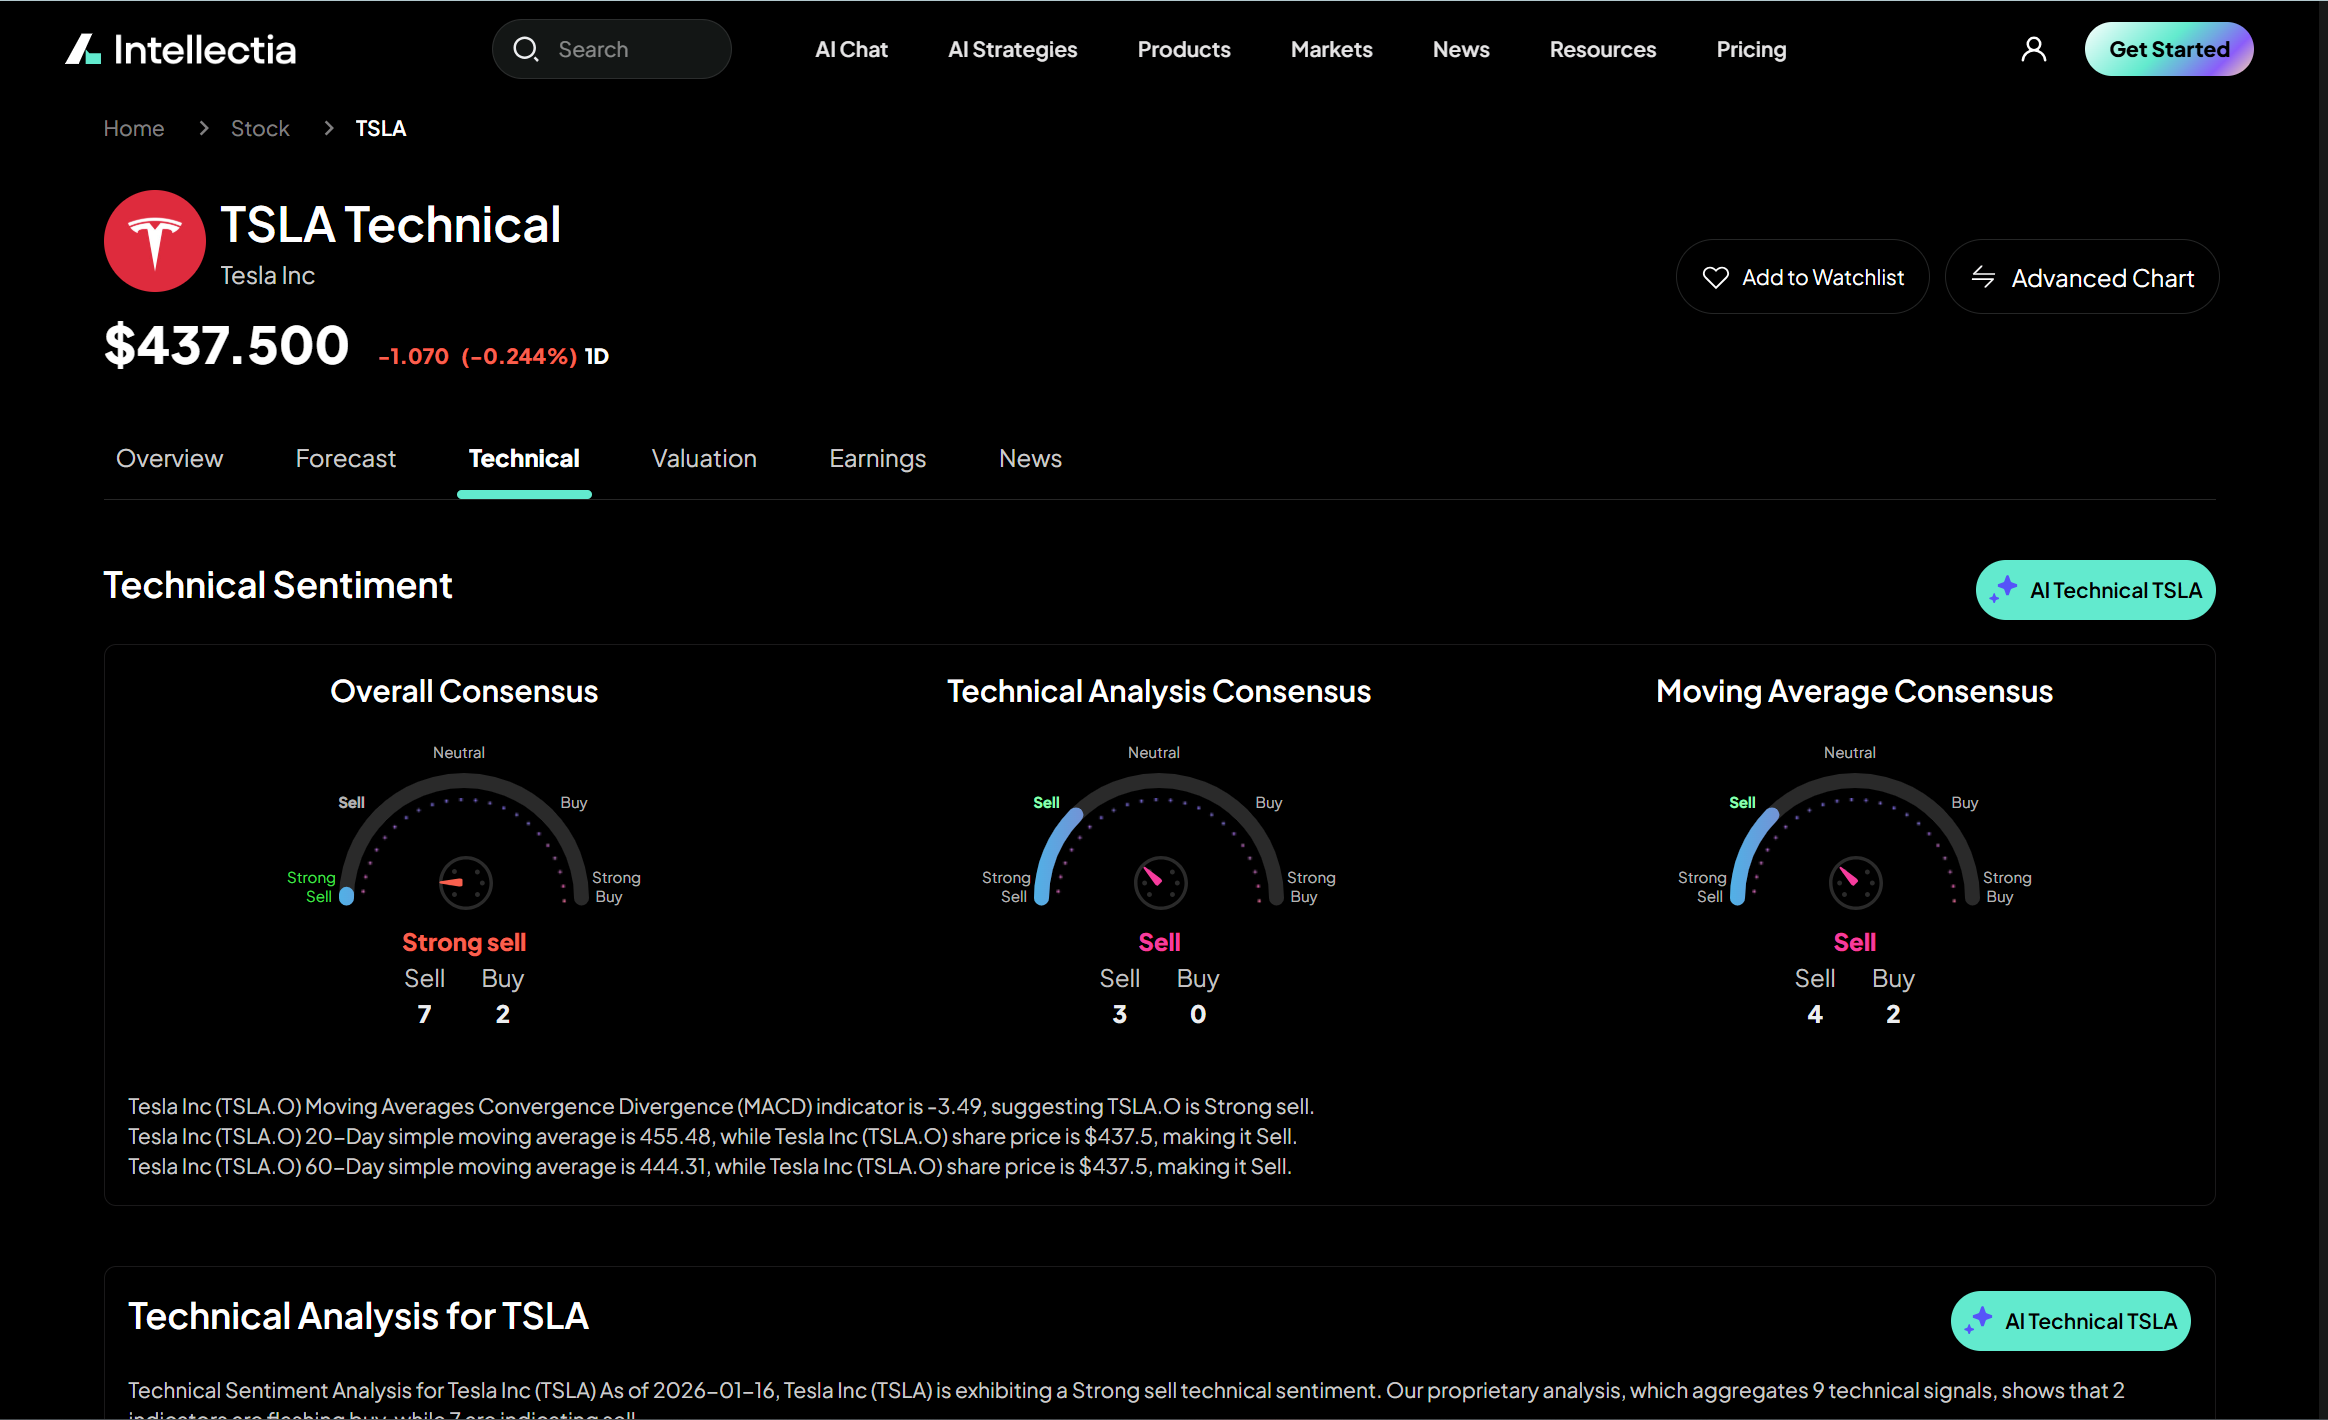
1. Proprietary AI Technical Sentiment
We’ve introduced a new Overall Consensus engine. Instead of looking at a single indicator, our AI now aggregates 9 distinct technical signals to give you a definitive sentiment—ranging from Strong Sell to Strong Buy.
What it does: It filters out the noise by weighing indicators against each other, showing you exactly how many signals are flashing "Buy" vs. "Sell."
2. Expanded Momentum Indicators & Oscillators
We’ve added a dedicated Momentum section that tracks more than just the RSI. You can now monitor:
MACD (12, 26, 9): Get clear short-term trend signals.
Stochastic Oscillator & Stochastic RSI: Identify overbought or oversold conditions with higher precision.
Commodity Channel Index (CCI) & Awesome Oscillator (AO): New specialized tools to help identify cyclical trends and momentum shifts.
3. Dynamic Support & Resistance Levels
Finding "the floor" and "the ceiling" just got easier. Our system now automatically calculates:
Classic Pivot Points: Standard levels for daily trading.
Fibonacci Retracements: Advanced S1/R1 levels based on the Golden Ratio to help you spot potential reversals before they happen.
4. Multi-Timeframe Moving Averages (MA)
We have expanded our Moving Average table to include 6 different periods (from the 5-Day to the 250-Day average).
Instant Signal Logic: The system now compares the current price to each MA automatically, labeling each as a "Buy" or "Sell" signal so you don’t have to do the math.
📊 Changelog at a Glance
[New] Added AI Technical Sentiment summary card.
[New] Introduced Fibonacci Support & Resistance levels.
[Improved] Updated MACD & RSI data to refresh daily.
[Fixed] Optimized mobile view for Support/Resistance tables.
Try it out now! Head over to the Technical tab on your favorite stock’s profile (e.g., TSLA Technical Analysis) to see the new data in action.