TS Overview
-
$
0.000
0.000(0.000%)
At close0.000(0.000%)Aft-market
ET
Loading chart...

The current price of TS is 57.22 USD — it has decreased -3.2
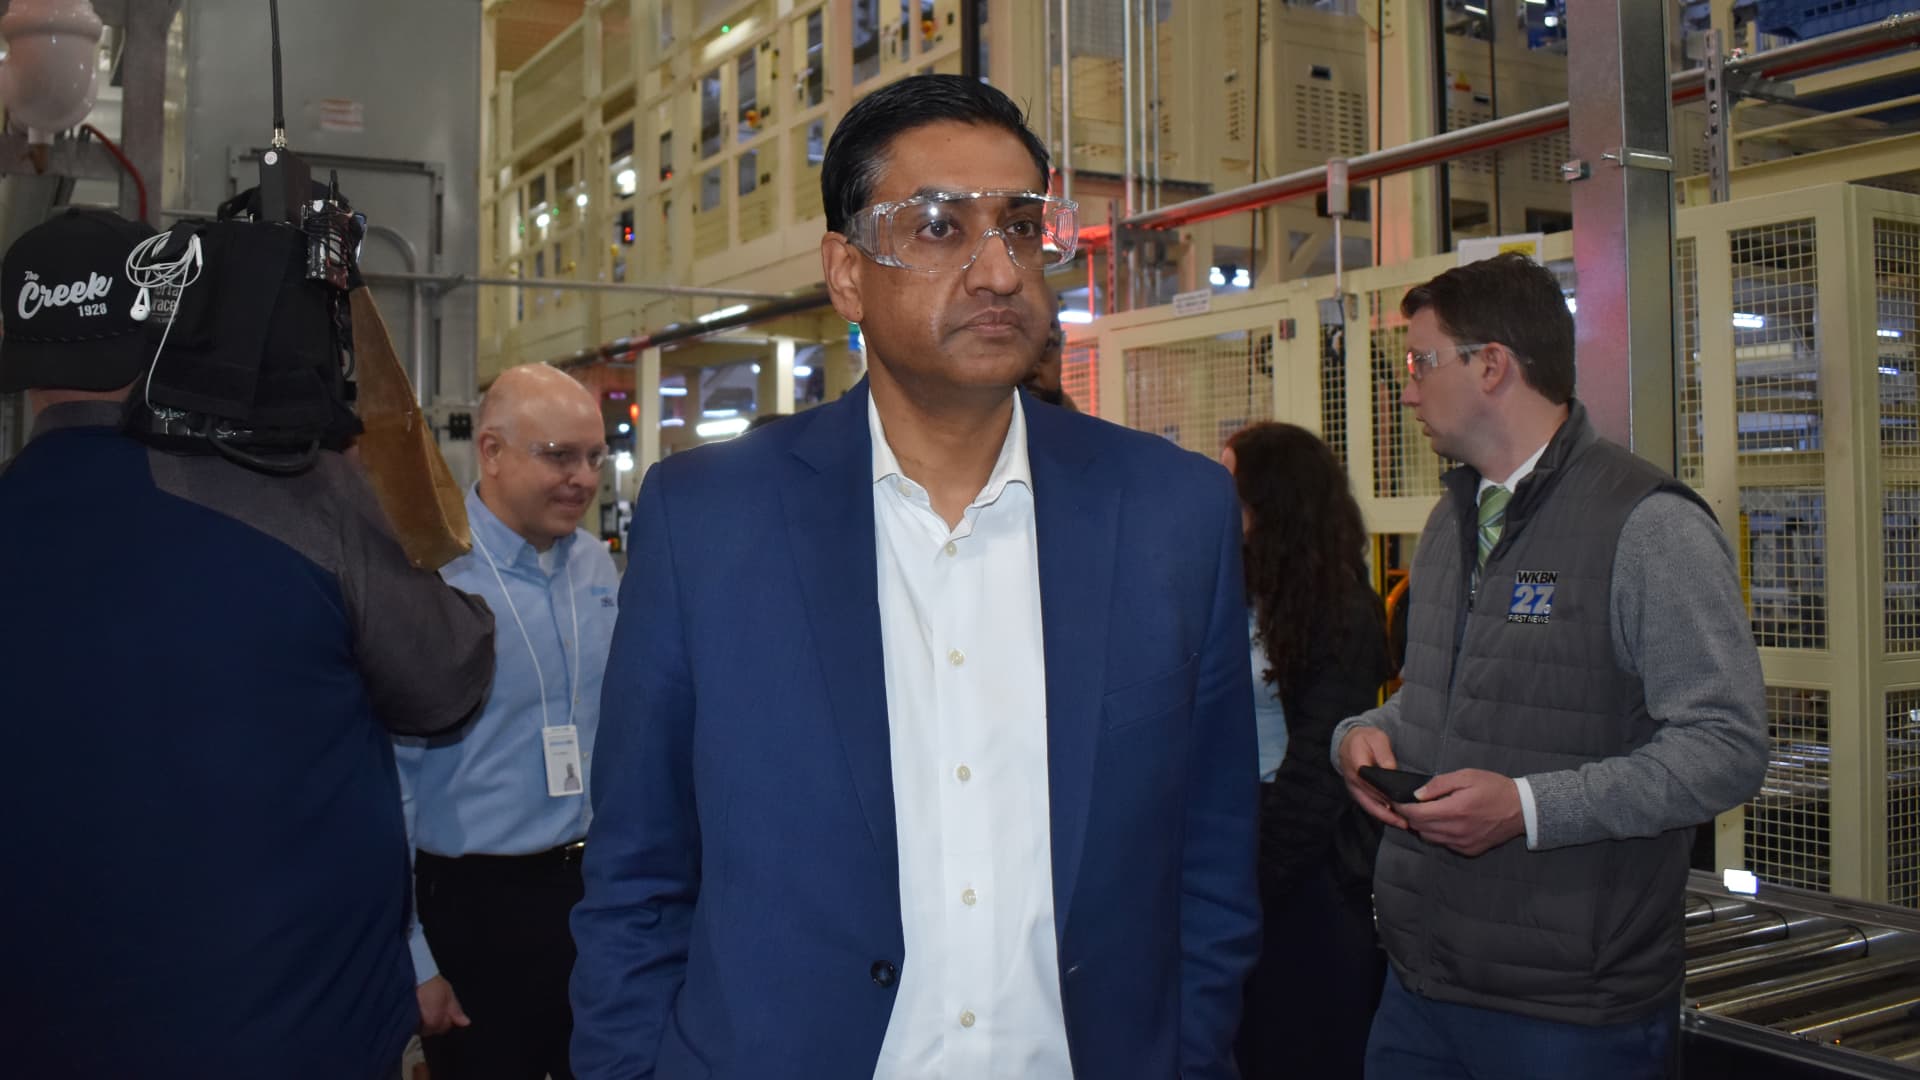
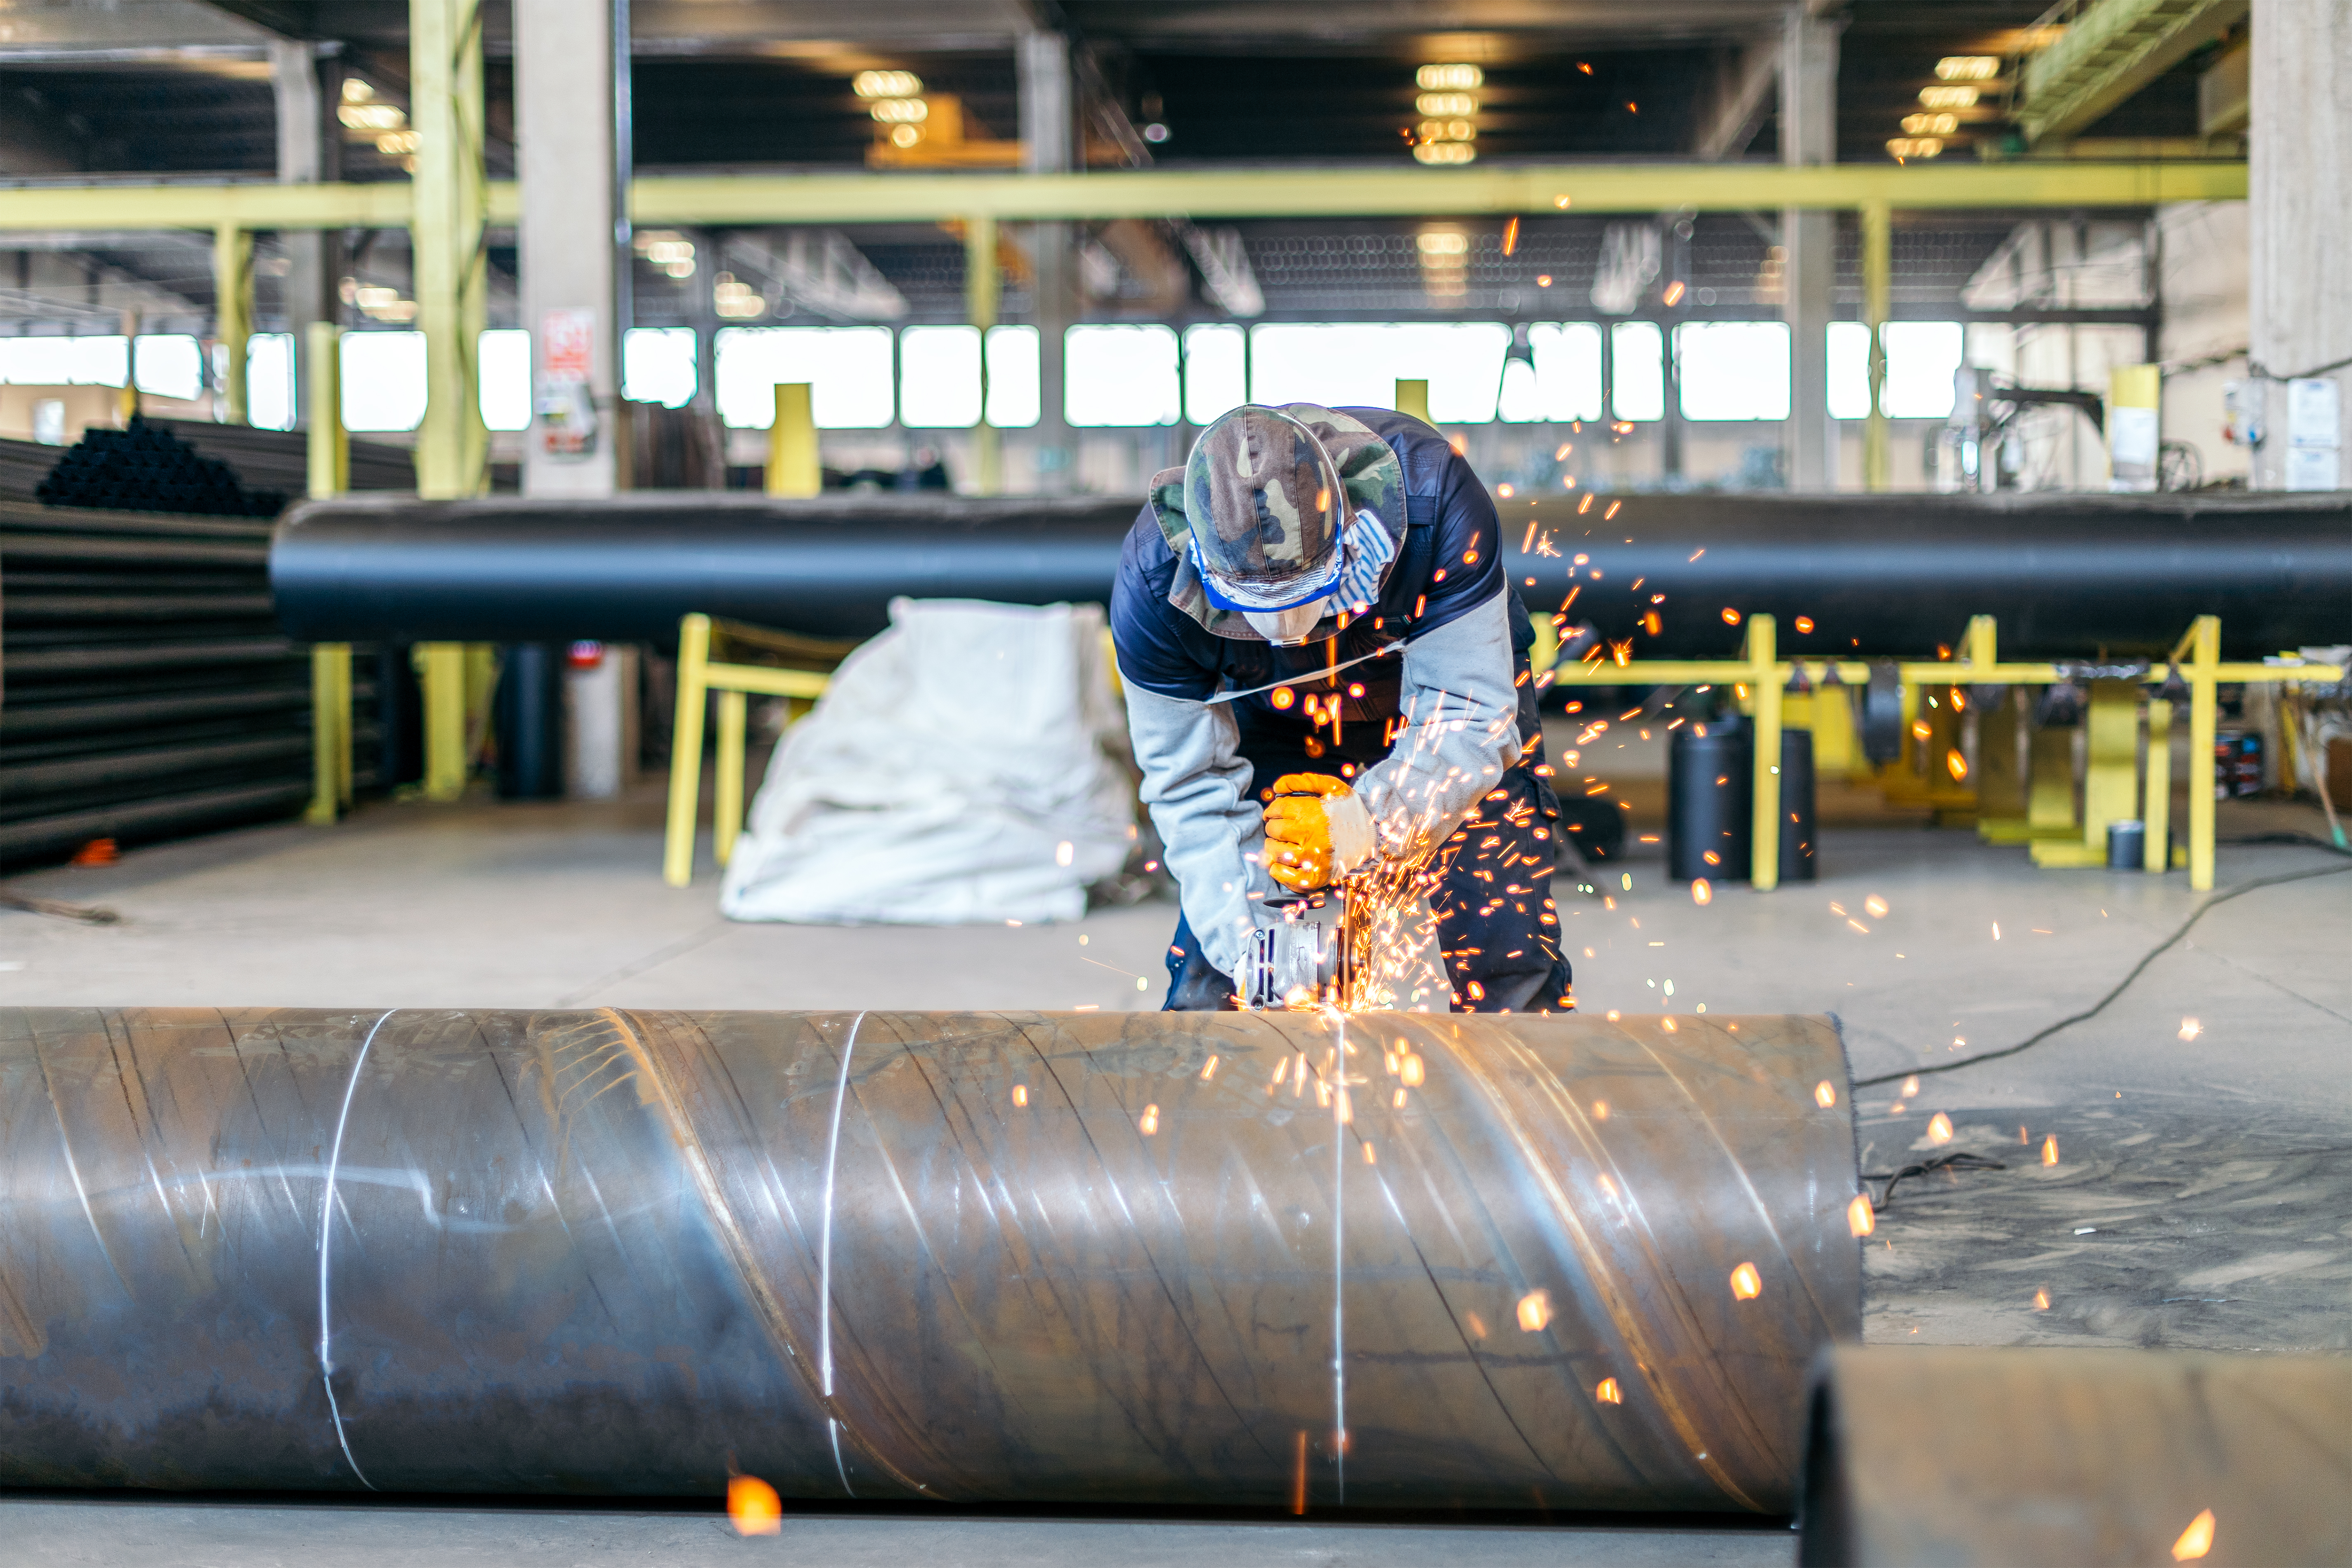
Tenaris S.A. is a holding company, which is a steel producer with production facilities in Mexico, Argentina, Colombia, United States and Guatemala. The Company supplies round steel bars and flat steel products for its pipes business. It operates through Tubes business segment. The Tubes segment includes the production and sale of both seamless and welded steel tubular products, and related services primarily for the oil and gas industry, principally oil country tubular goods (OCTG) used in drilling operations, and for other industrial applications with production processes that include in the transformation of steel into tubular products. It operates in geographical areas, such as North America, South America, Europe, Middle East and Africa, and Asia Pacific. Its products and services include OCTG, Premium Connections, Rig Direct, Offshore Line Pipe, Onshore Line Pipe, Hydrocarbon Processing, Power Generation, Sucker Rods, Coiled Tubing, Industrial and Mechanical, and Automotive.
Wall Street analysts forecast TS stock price to rise over the next 12 months. According to Wall Street analysts, the average 1-year price target for TS is43.43 USD with a low forecast of 36.00 USD and a high forecast of 48.00 USD. However, analyst price targets are subjective and often lag stock prices, so investors should focus on the objective reasons behind analyst rating changes, which better reflect the company's fundamentals.
Tenaris SA revenue for the last quarter amounts to 3.10B USD, increased 6.10
Tenaris SA. EPS for the last quarter amounts to 0.54 USD, increased 14.89
Tenaris SA (TS) has 24875 emplpoyees as of June 20 2026.
Today TS has the market capitalization of 28.89B USD.