SBUX Overview
-
$
0.000
0.000(0.000%)
At close0.000(0.000%)Aft-market
ET
Loading chart...

The current price of SBUX is 100.65 USD — it has increased 0.83
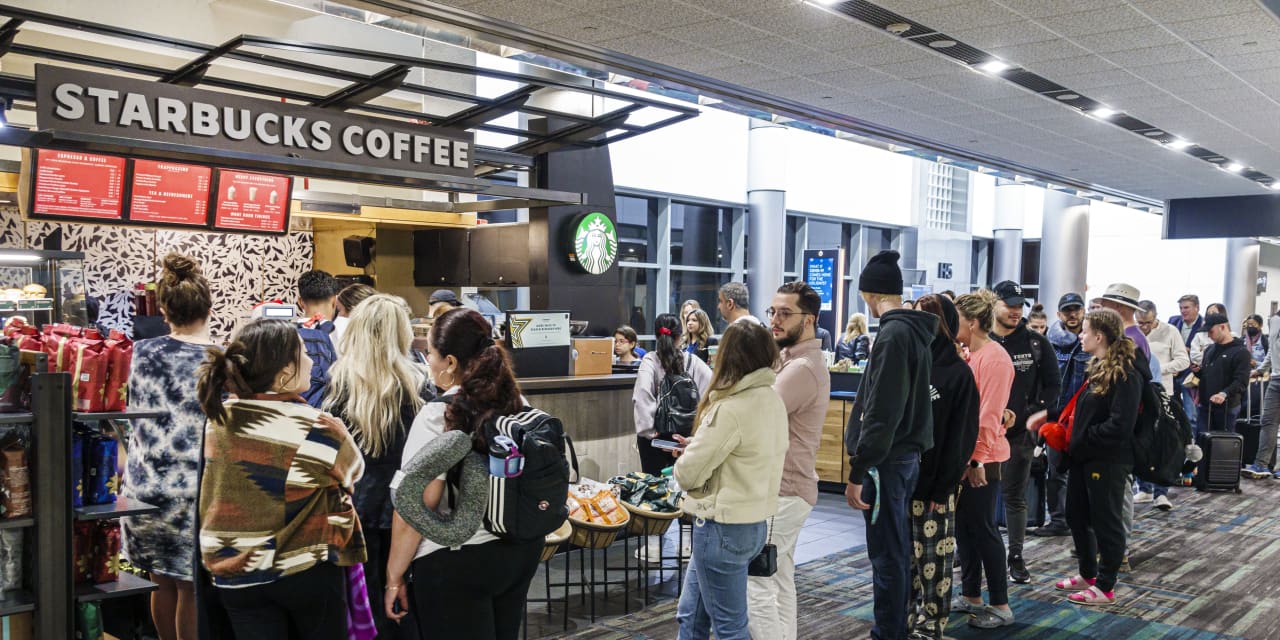
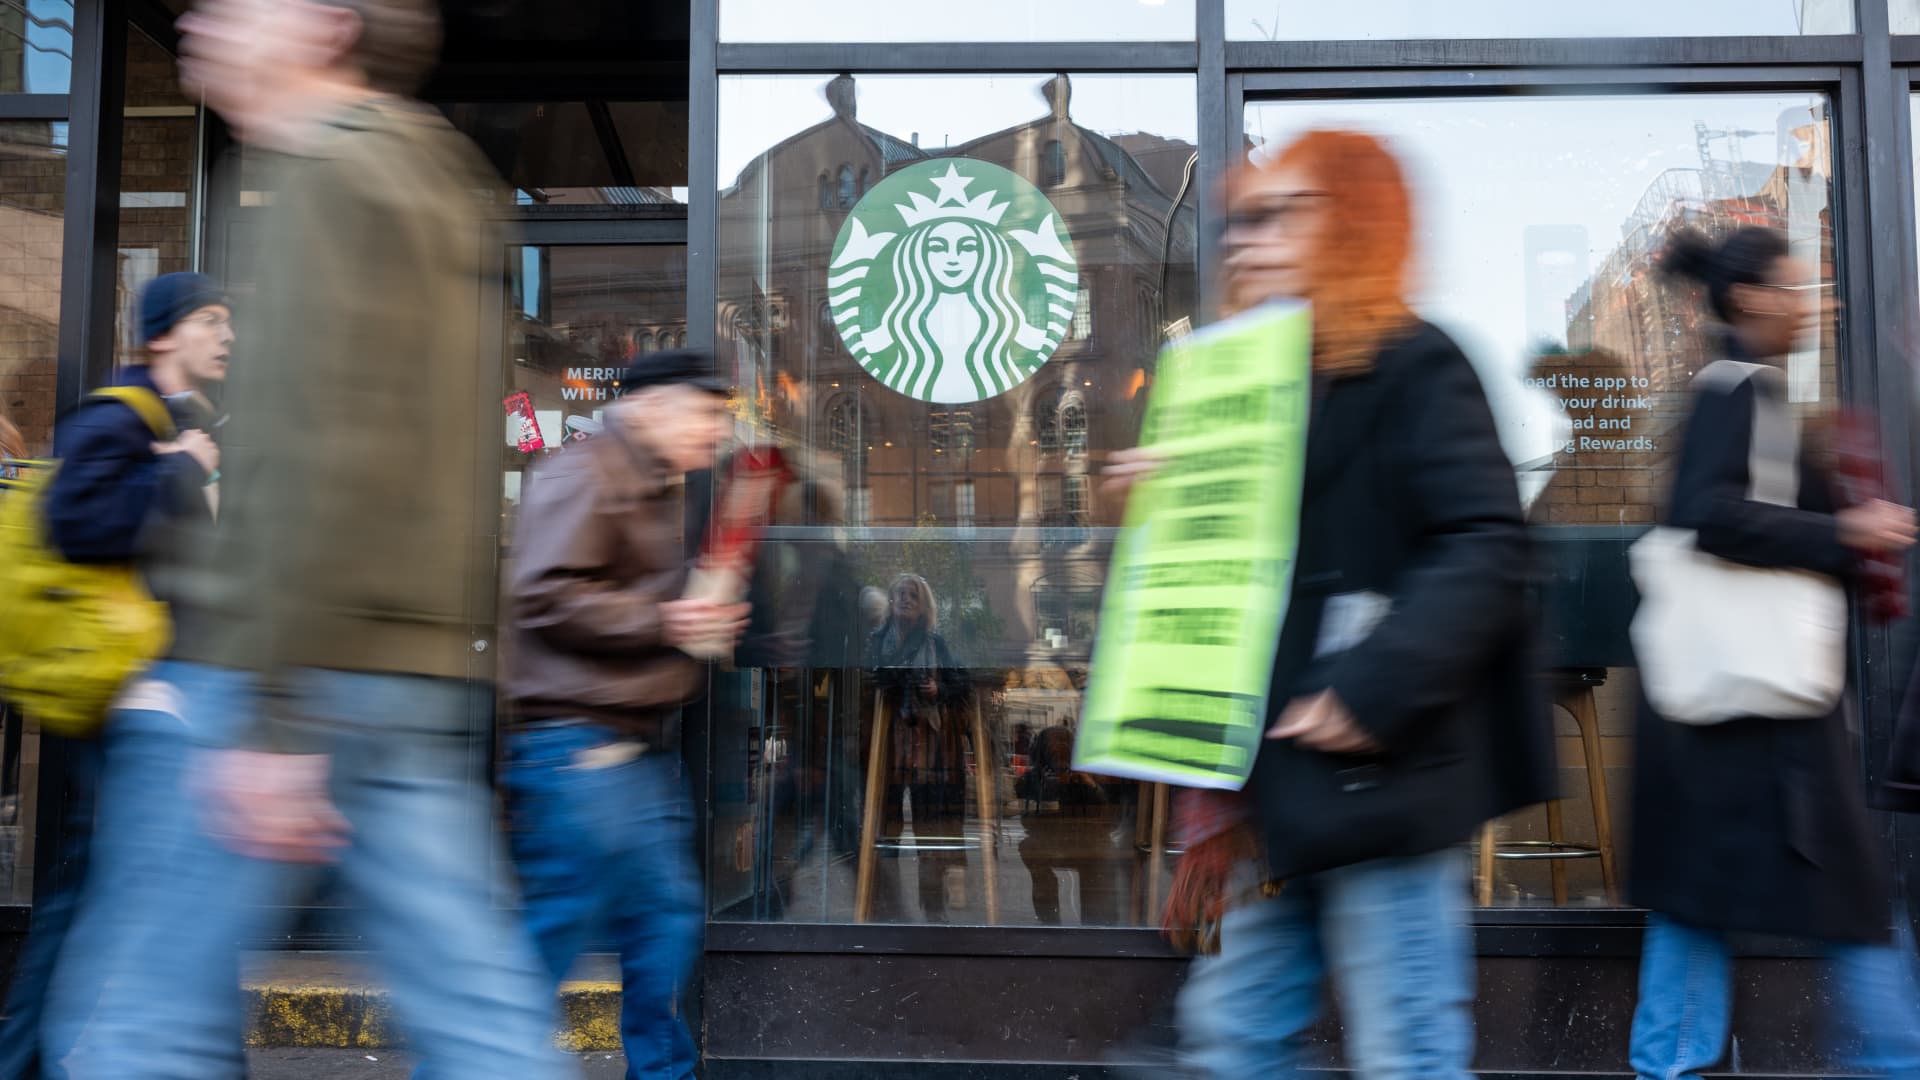
Starbucks Corporations is a roaster, marketer, and retailer of specialty coffee globally. Its North America segment includes the United States and Canada. Its International segment includes China, Japan, Asia Pacific, Europe, Middle East and Africa, Latin America, and the Caribbean. Its North America and International segments include both Company-operated and licensed stores. The Channel Development segment includes roasted whole bean and ground coffees, Starbucks-branded single-serve products, a variety of ready-to-drink beverages, such as Frappuccino and Starbucks Doubleshot, foodservice products, and other branded products sold outside the Company-operated and licensed stores. A large portion of its Channel Development business operates under a licensed model of the Global Coffee Alliance with Nestle, while its global ready-to-drink businesses operate under collaborative relationships with PepsiCo, Inc., Tingyi-Ashi Beverages Holding Co., Ltd., Arla Foods amba, Nestle, and others.
Wall Street analysts forecast SBUX stock price to rise over the next 12 months. According to Wall Street analysts, the average 1-year price target for SBUX is96.12 USD with a low forecast of 59.00 USD and a high forecast of 115.00 USD. However, analyst price targets are subjective and often lag stock prices, so investors should focus on the objective reasons behind analyst rating changes, which better reflect the company's fundamentals.
Starbucks Corp revenue for the last quarter amounts to 9.53B USD, increased 8.79
Starbucks Corp. EPS for the last quarter amounts to 0.45 USD, increased 32.35
Starbucks Corp (SBUX) has 381000 emplpoyees as of June 21 2026.
Today SBUX has the market capitalization of 114.71B USD.