HDB Overview
-
$
0.000
0.000(0.000%)
At close0.000(0.000%)Aft-market
ET
Loading chart...


The current price of HDB is 25.06 USD — it has increased 1.21
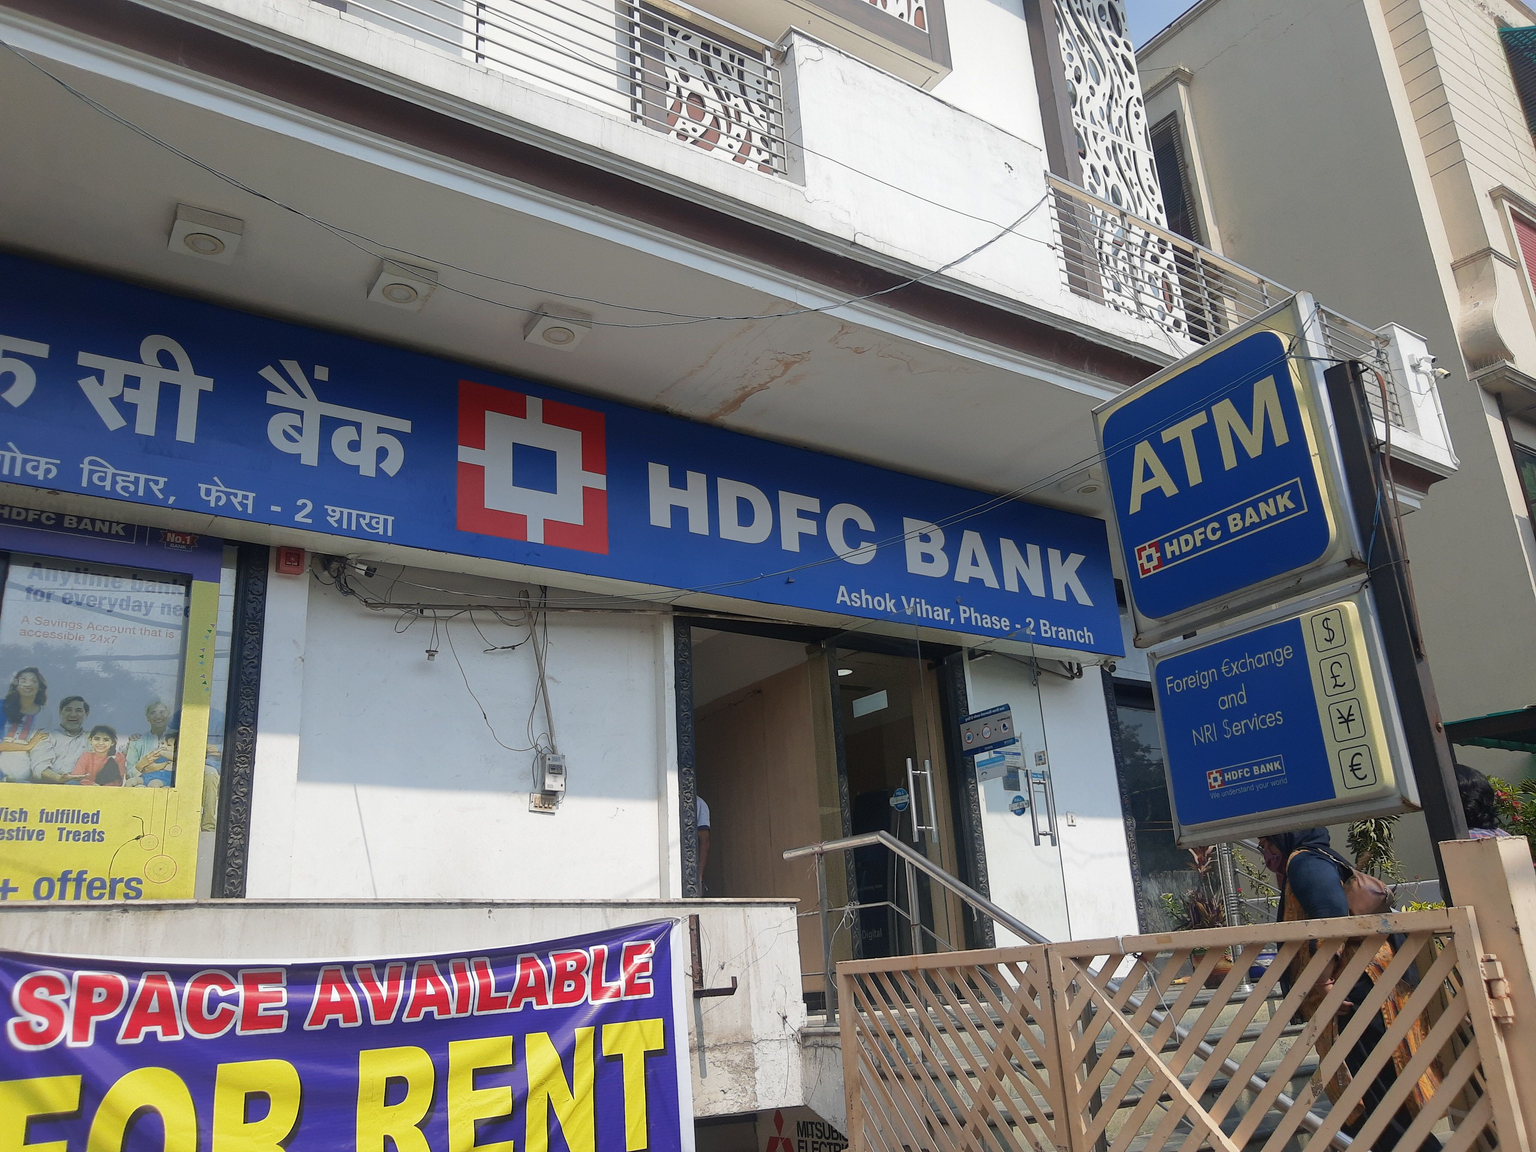
HDFC Bank Limited (the Bank) is an India-based banking company. The Bank, along with its subsidiaries, is engaged in providing a range of banking and financial services, including retail banking, wholesale banking, treasury operations, insurance, asset management, stockbroking and other financial services businesses. Its segment includes treasury, retail banking, wholesale banking, and other banking operations. The treasury segment consists of net interest earnings from the Bank’s investment portfolio, money market borrowing and lending, and gains or losses on investment operations. The retail banking segment consists of digital banking and other retail banking. The wholesale banking segment provides loans, non-fund facilities and transaction services to corporates, emerging corporates, public sector units, government bodies, and others. The other banking operations segment includes parabanking activities such as credit cards, debit cards, third-party product distribution, and others.
Wall Street analysts forecast HDB stock price to fall over the next 12 months. According to Wall Street analysts, the average 1-year price target for HDB is USD with a low forecast of USD and a high forecast of USD. However, analyst price targets are subjective and often lag stock prices, so investors should focus on the objective reasons behind analyst rating changes, which better reflect the company's fundamentals.
HDFC Bank Ltd revenue for the last quarter amounts to 7.61B USD, increased 65.38
HDFC Bank Ltd. EPS for the last quarter amounts to 0.14 USD, decreased 0.00
HDFC Bank Ltd (HDB) has 214521 emplpoyees as of June 21 2026.
Today HDB has the market capitalization of 127.84B USD.