Intellectia LogoIntellectia
Product
Resources
Markets
News
Partner Program
Pricing
Log inTry for Free
Intellectia Logo
Log in
Intellectia Logo

Product

Features
Financial AI Agent
Stock Technical Analysis
Stock Monitor
Hedge Fund Tracker
AI Screener
Trading Strategies
AI Stock Picker
Swing Trading
Quant AI
Stock Chart Patterns
Daytrading Center
AI Earnings Prediction
Whales Auto Tracker
Backtesting Playground

Resources

Learn
Blog
Earnings
Tutorial
Help Center
Company
About Us
Contact
Press
Reward Program
Partner Program
Tools
Dividend Calculator
Dividend Yield Calculator
Options Profit Calculator
Compare
TradingView
SeekingAlpha

Markets

Trending Stocks
Hot Crypto
Trending News
All Stocks

News

Trading News
Overview
Top News
Daily Market Brief
Earnings
Latest
Newswire
Stock News
Crypto News
Monitor News
Partner ProgramPricing
Start for Free
  1. Home
  2. >
  3. Stock
  4. >
  5. MDV
stocks logo

MDV

-
collectAdd to Watchlistadvanced chartAdvanced Chart
$
0.000
0(0.000%)1D
collectadvanced chart
    Overview
    Forecast
    Valuation
    Earnings
High
--
Open
--
VWAP
--
Vol
--
Mkt Cap
--
Low
--
Amount
--
EV/EBITDA(TTM)
--
Total Shares
--
EV
--
EV/OCF(TTM)
--
P/S(TTM)
--
Intellectia AI SwingMax

Market Estimates

Earnings Estimates
Earnings Estimates
Revenue
YoY Chg
EPS
YoYChg
FY2025Q3
FY2025Q4
FY2026Q1
11.43M
-1.99%
0.000
-100%
11.55M
-1.5%
0.020
-71.43%
11.69M
-0.64%
-0.035
+250%
Estimates Revision
The market is revising Downward the revenue expectations for Modiv Industrial, Inc. (MDV) for FY2025, with the revenue forecasts being adjusted by -2.03% over the past three months. During the same period, the stock price has changed by -4.26%.
Revenue Estimates for FY2025
Revise Downward
down Image
-2.03%
In Past 3 Month
EPS Estimates for FY2025
Revise Downward
down Image
-566.67%
In Past 3 Month
Stock Price
Go Down
down Image
-4.26%
In Past 3 Month

Valuation Metrics

The current forward P/E ratio for Modiv Industrial Inc (MDV.N) is 108.22, compared to its 5-year average forward P/E of 104.99. For a more detailed relative valuation and DCF analysis to assess Modiv Industrial Inc 's fair value, click here.
  • Forward PE
  • Forward EV/EBITDA
  • Forward PS

Forward PE

The forward P/E ratio is a valuation metric that divides a company's current stock price by its estimated future earnings per share over the next 12 months.
StronglyUndervaluedUndervaluedFairOvervaluedStronglyOvervalueddotted line Image
N/A
5Y Average PE
104.99
Current PE
108.22
Overvalued PE
355.79
Undervalued PE
-145.81

Forward EV/EBITDA

The forward EV/EBITDA ratio is a valuation metric that divides a company's enterprise value (EV) by its estimated future earnings before interest, taxes, depreciation, and amortization (EBITDA) over the next 12 months.
StronglyUndervaluedUndervaluedFairOvervaluedStronglyOvervalueddotted line Image
N/A
5Y Average EV/EBITDA
12.01
Current EV/EBITDA
0.00
Overvalued EV/EBITDA
13.05
Undervalued EV/EBITDA
10.97

Forward PS

The forward P/S ratio is a valuation metric that divides a company's current stock price by its estimated future sales (or revenue) per share over the next 12 months.
StronglyUndervaluedUndervaluedFairOvervaluedStronglyOvervalueddotted line Image
N/A
5Y Average PS
2.74
Current PS
0.00
Overvalued PS
3.46
Undervalued PS
2.03
AI Stock Picker
AI Stock Picker

Financials

Annual
Quarterly
N/A
Total Revenue
N/A
Operating Profit
N/A
Net Income after Tax
N/A
EPS - Diluted
N/A
Free Cash Flow
N/A
Gross Profit Margin - %
N/A
Net Margin - %

Trading Trends

  • Insider
  • Hedge Fund
  • Congress Trading
Insider
Insiders are Neutral. There are no significant trading trends over the last month.
Sold
Bought
Hedge Fund
Hedge Funds are Neutral. There are no significant trading trends over the last quarter.
Sold
Bought
Congress Trading
Congress are Neutral. There are no significant trading trends over the last month.
Sold
Bought
Insider
Insiders are Neutral. There are no significant trading trends over the last month.
Sold
Bought
Financial AI Agent
Financial AI Agent

MDV News & Events

Events Timeline

(ET)
2025-11-14
16:11:36
Modiv announces Q3 AFFO of 36 cents, surpassing consensus estimate of 34 cents.
select
2025-08-07 (ET)
2025-08-07
06:15:29
Modiv reports Q2 AFFO 38c, consensus 36c
select
2025-05-07 (ET)
2025-05-07
06:29:22
Modiv reports Q1 AFFO 33c, consensus 31c
select
Sign Up For More Events

News

[object Object]
Preview
4.5
11-15SeekingAlpha
Modiv Industrial Indicates Strategic Asset Recycling and Increased Selectivity in Unstable Deal Environment
  • Management Insights: CEO Aaron Halfacre expressed optimism about the company's future, highlighting a stronger balance sheet and a systematic approach to asset recycling, while acknowledging market uncertainties and the potential for a new Fed regime by May.

  • Financial Results: The company recognized a one-time $300,000 fee in Q3 and is actively managing properties for sale, including the Clara and Costco properties, with expectations for sales by early January.

  • Analyst Sentiment: Analysts showed cautious interest in the company's deal flow and capital sources, reflecting a shift from frustration to optimism regarding transaction opportunities and strategic direction.

  • Risks and Outlook: Management identified ongoing challenges such as market volatility and unpredictable capital flows, but remains confident in the company's resilience and ability to adapt amidst a changing market environment.

[object Object]
Preview
3.0
11-15NASDAQ.COM
Earnings Report for November 14, 2025: QUBT, HIVE, VENU, NXXT, MDV, DFLI, FORA, BEEM, TOMZ, BNZI Released After Market Hours
  • Earnings Reports Overview: Several companies, including Quantum Computing Inc. (QUBT), HIVE Digital Technologies Ltd (HIVE), and Venu Holding Corporation (VENU), are set to report earnings for the quarter ending September 30, 2025, with varying forecasts and performance expectations.

  • Performance Expectations: QUBT is expected to see a 16.67% increase in earnings per share (EPS) compared to last year, while HIVE anticipates an 83.33% increase. In contrast, companies like Forian Inc. (FORA) and Beam Global (BEEM) are projected to experience significant decreases in EPS.

  • Price to Earnings Ratios: The Price to Earnings (P/E) ratios for these companies vary widely, with QUBT at -55.72 and HIVE at -61.00, indicating differing growth expectations compared to their industry averages.

  • Analyst Consensus and Surprises: Many companies, such as Banzai International, Inc. (BNZI) and TOMI Environmental Solutions, Inc. (TOMZ), have faced challenges in meeting analyst expectations, with some reporting significant negative surprises in previous quarters.

[object Object]
Preview
9.5
11-15SeekingAlpha
Modiv's FFO of $0.36 exceeds expectations by $0.02, while revenue of $11.7M falls short by $0.03M.
  • Q3 Financial Performance: Modiv (MDV) reported a Q3 FFO of $0.36, exceeding expectations by $0.02, while revenue reached $11.7 million, a 0.3% year-over-year increase, but fell short by $0.03 million.

  • Earnings Call Insights: The Q4 2023 earnings call transcript for Modiv Industrial provides further details on the company's financial outlook and performance.

  • Investment Opportunity: Modiv Industrial is highlighted as an undervalued opportunity, particularly in relation to the nearshoring trend, suggesting potential for growth.

  • Investment Strategy: There is a preference for a mixed investment approach involving both common and preferred shares of Modiv, indicating a diversified strategy for potential investors.

Sign Up For More News

People Also Watch

FAQ

arrow icon

What is Modiv Industrial Inc (MDV) stock price today?

The current price of MDV is 14.61 USD — it has decreased -0.41 % in the last trading day.

arrow icon

What is Modiv Industrial Inc (MDV)'s business?

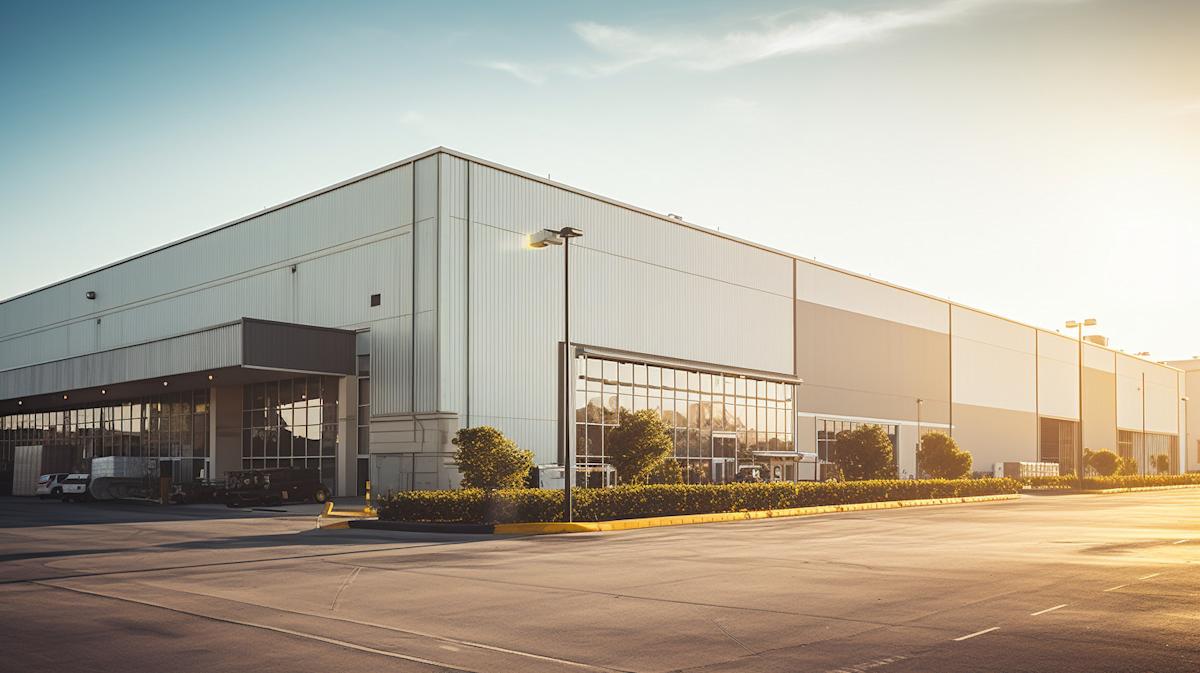
Modiv Industrial, Inc. is an internally managed real estate investment trust (REIT), which is focused on single-tenant net-lease industrial manufacturing real estate. The Company acquires, owns and manages a portfolio of single-tenant net-lease properties throughout the United States, with a focus on critical industrial manufacturing properties with long-term leases to tenants that fuel the national economy and strengthen the nation’s supply chains. The Company also owns non-core, legacy retail and office real estate properties. It seeks to provide investors with access to monthly dividends through a durable portfolio of real estate investments designed to generate both current income and long-term growth. Its real estate investment portfolio consisted of 43 operating properties, including one property held for sale. Its portfolio is distributed across 16 states and consists of 39 industrial properties.

arrow icon

What is the price predicton of MDV Stock?

Wall Street analysts forecast MDV stock price to fall over the next 12 months. According to Wall Street analysts, the average 1-year price target for MDV is  USD with a low forecast of USD and a high forecast of USD. However, analyst price targets are subjective and often lag stock prices, so investors should focus on the objective reasons behind analyst rating changes, which better reflect the company's fundamentals.

arrow icon

What is Modiv Industrial Inc (MDV)'s revenue for the last quarter?

Modiv Industrial Inc revenue for the last quarter amounts to 11.69M USD, increased 0.27 % YoY.

arrow icon

What is Modiv Industrial Inc (MDV)'s earnings per share (EPS) for the last quarter?

Modiv Industrial Inc. EPS for the last quarter amounts to 0.00 USD, decreased -100.00 % YoY.

arrow icon

What changes have occurred in the market's expectations for Modiv Industrial Inc (MDV)'s fundamentals?

The market is revising Downward the revenue expectations for Modiv Industrial, Inc. (MDV) for FY2025, with the revenue forecasts being adjusted by -2.03% over the past three months. During the same period, the stock price has changed by -4.26%.
arrow icon

How many employees does Modiv Industrial Inc (MDV). have?

Modiv Industrial Inc (MDV) has 12 emplpoyees as of December 05 2025.

arrow icon

What is Modiv Industrial Inc (MDV) market cap?

Today MDV has the market capitalization of 150.12M USD.

Intellectia LogoIntellectiaIntellectia LogoIntellectia

Redefine Your Investment Decisions

TwitterTwitterYoutubeYoutubeQuoraQuoraDiscordDiscordLinkedinLinkedinTelegramTelegram
AppStoreGooglePlay

Copyright © 2025 Intellectia.AI. All Rights Reserved.

pci certified logo
Company
HomeContactAbout UsNews Release
Compare
TradingViewSeeking Alpha
Features
Financial AI AgentStock Technical AnalysisStock MonitorHedge Fund TrackerAI ScreenerDaytrading Center
Strategies
AI Stock PickerSwing TradingStock Chart PatternsEarnings TradingDaytrading CenterAI Earnings PredictionQuant AIWhales Auto TrackerBacktesting Playground
Free Tools
Dividend CalculatorDividend Yield CalculatorOptions Profit Calculator
Resource
BlogTutorialEarningsTrending StocksCrypto MarketPartner ProgramTerms of UsePrivacy PolicySecuritySitemap
Start for Free