
KALU
Kaiser Aluminum Corp
- Overview
- Forecast
- Valuation
- Earnings

Line
|

Candle
1D
5D
1M
3M
6M
YTD
1Y
5Y
High
82.310
Open
82.310
VWAP
--
Vol
22.71K
Mkt Cap
1.33B
Low
80.530
Amount
--
EV/EBITDA(TTM)
9.99
Total Shares
16.07M
EV
2.40B
EV/OCF(TTM)
15.92
P/S(TTM)
0.43
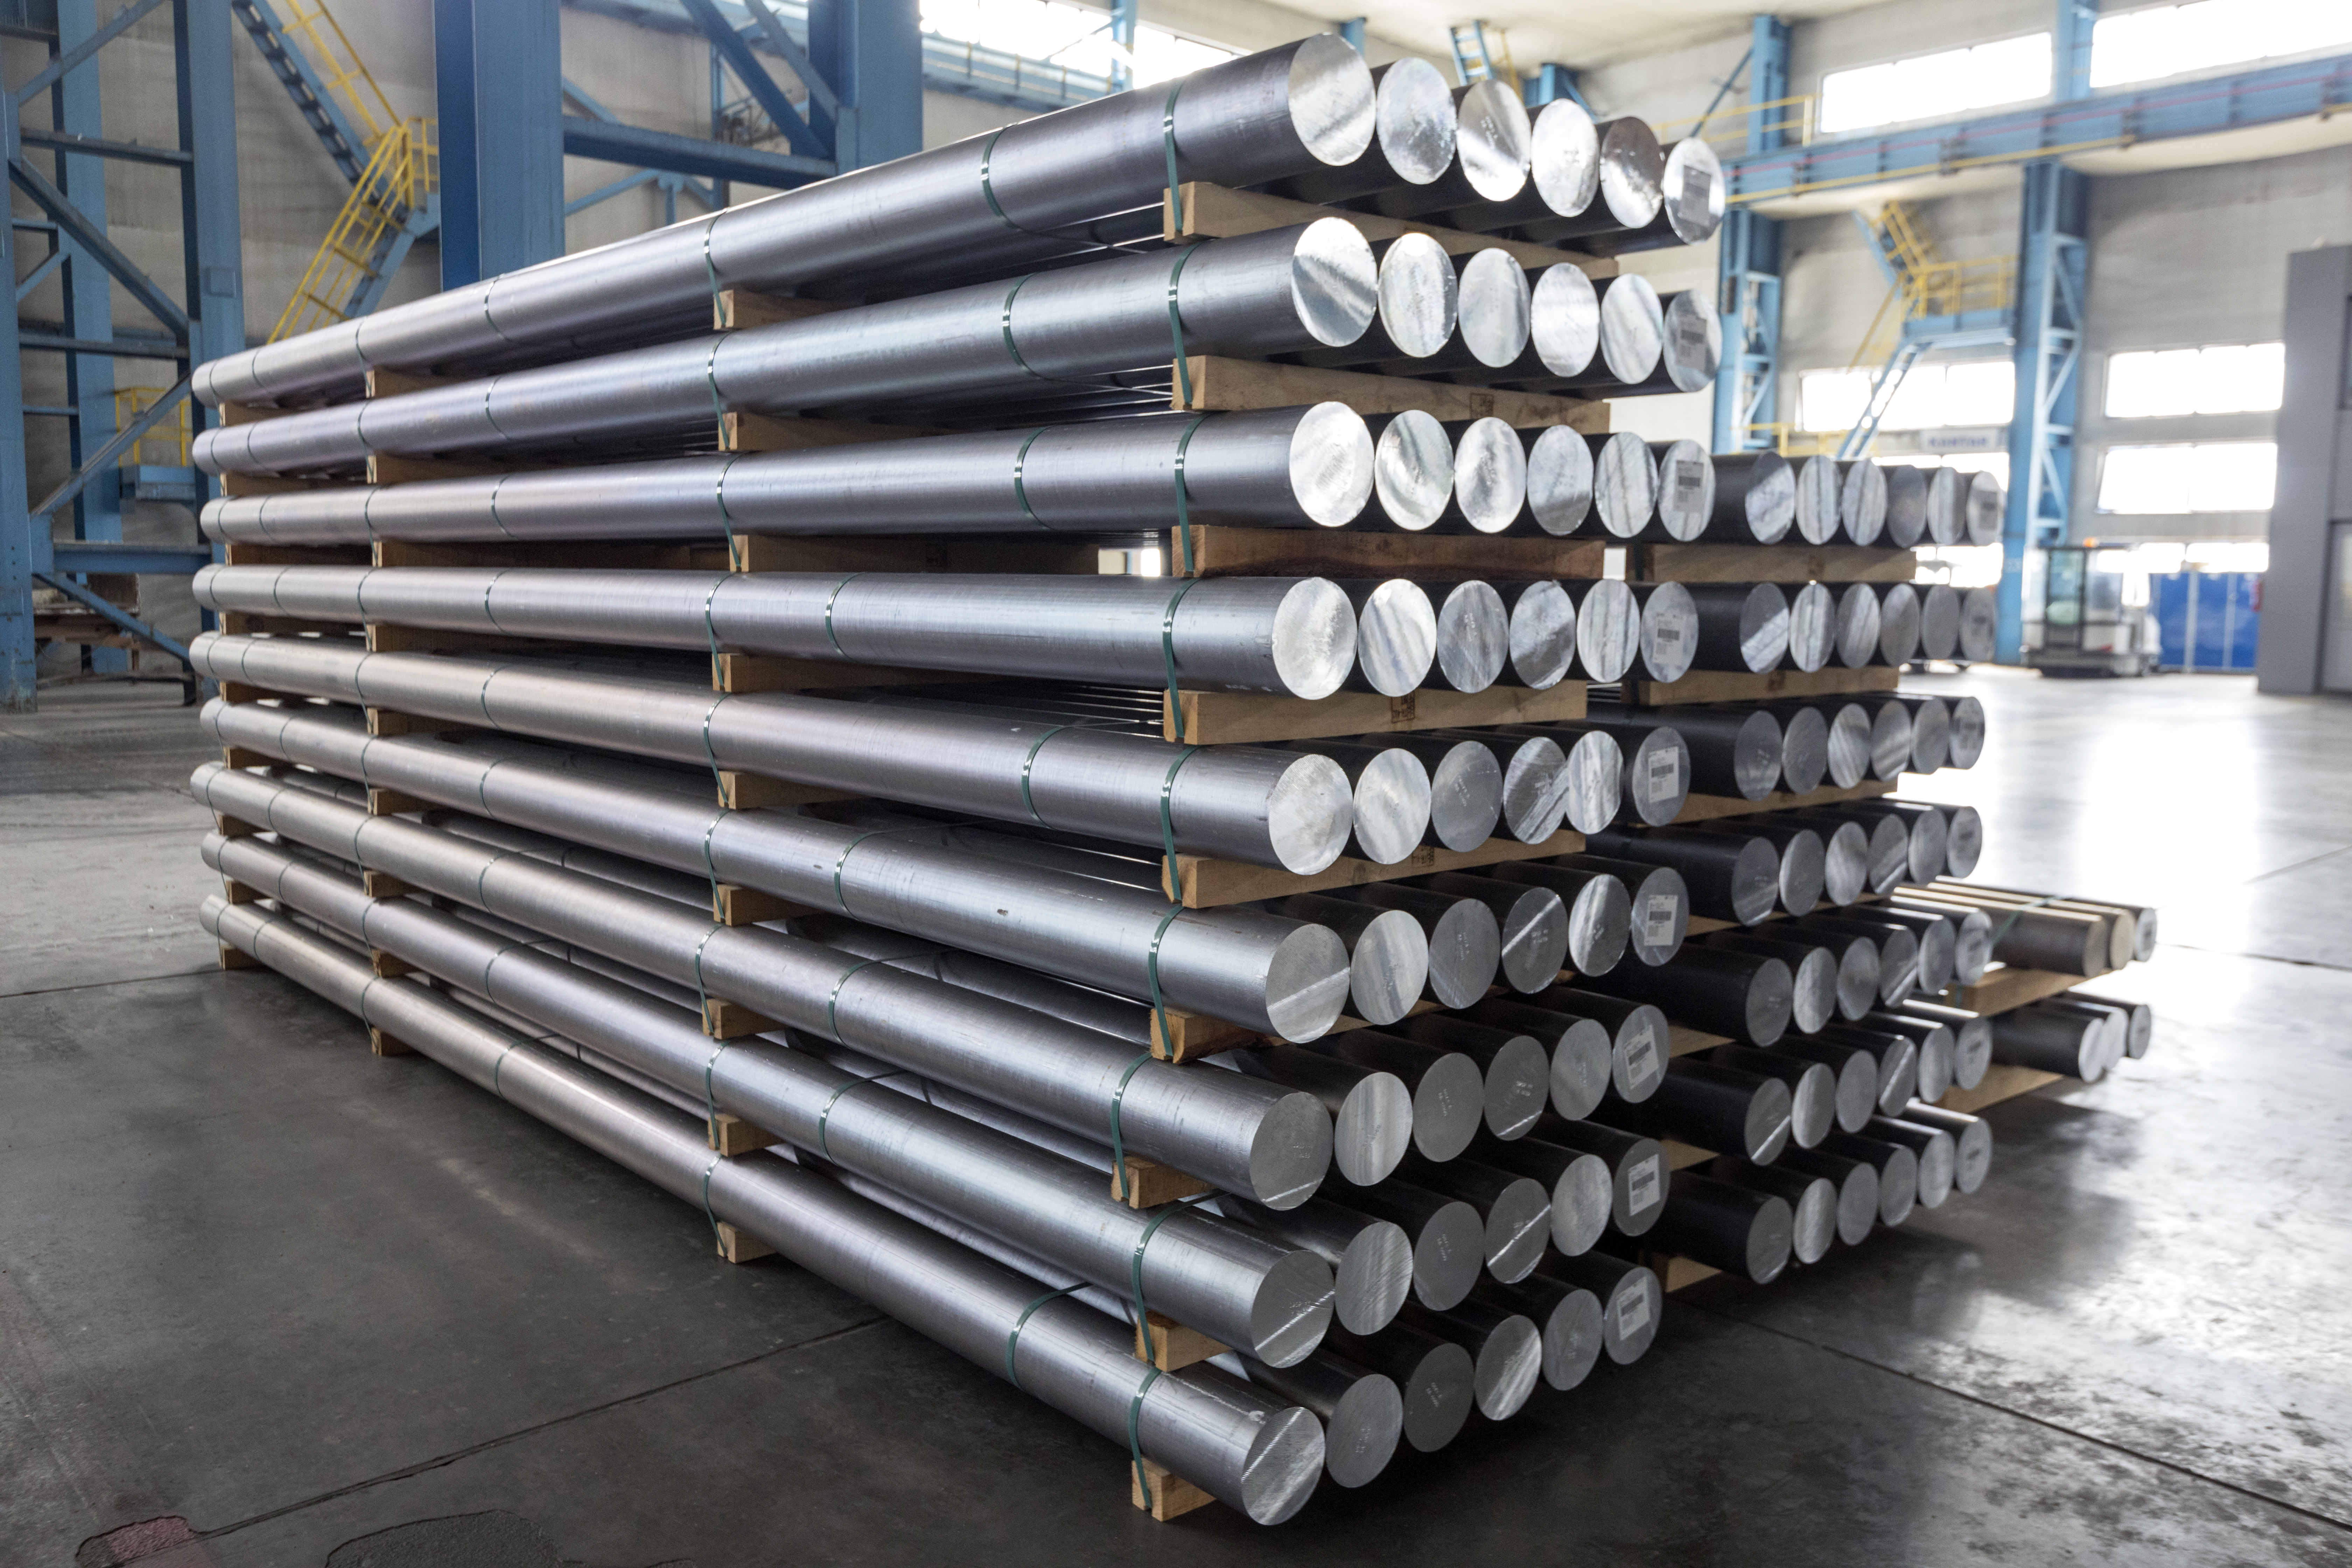
Kaiser Aluminum Corporation is a producer of semi-fabricated specialty aluminum products. The Company's fabricated aluminum mill products include flat-rolled (plate, sheet, and coil), extruded (rod, bar, hollows, and shapes), drawn (rod, bar, pipe, tube and wire) and certain cast aluminum products. Its business focuses on producing rolled, extruded, and drawn aluminum products used principally for aerospace and defense, aluminum beverage and food packaging, general engineering that includes consumer durables, electronics and products for electrical and machinery and equipment applications, and automotive products. It provides its products for a range of market applications, including aerospace and high strength (Aero/HS products); beverage and food packaging products (Packaging); general engineering (GE products); automotive (Automotive Extrusions); and other products. Its Automotive Extrusions consist of extruded aluminum products for many North American automotive applications.
Show More
Market Estimates
Earnings Estimates
Revenue
YoY Chg
EPS
YoYChg
FY2026Q1
FY2025Q4
FY2025Q3
825.80M
+6.23%
1.565
+8.68%
880.75M
+15.07%
1.618
+390.19%
846.85M
+13.26%
1.090
+113.67%
Estimates Revision
The market is revising No Change the revenue expectations for Kaiser Aluminum Corporation (KALU) for FY2025, with the revenue forecasts being adjusted by 0% over the past three months. During the same period, the stock price has changed by 24.54%.
Revenue Estimates for FY2025
No Change

0.00%
In Past 3 Month
EPS Estimates for FY2025
No Change

0.00%
In Past 3 Month
Stock Price
Go Up

+24.54%
In Past 3 Month
2 Analyst Rating

-14.32% Downside
Wall Street analysts forecast KALU stock price to fall over the next 12 months. According to Wall Street analysts, the average 1-year price target for KALU is 69.00 USD with a low forecast of 64.00 USD and a high forecast of 74.00 USD. However, analyst price targets are subjective and often lag stock prices, so investors should focus on the objective reasons behind analyst rating changes, which better reflect the company's fundamentals.
1 Buy
1 Hold
0 Sell
Moderate Buy

-14.32% Downside
Current: 80.530

Low
64.00
Averages
69.00
High
74.00

-14.32% Downside
Current: 80.530

Low
64.00
Averages
69.00
High
74.00
Benchmark
Josh Sullivan
Strong Buy
Maintains
$100 → $74
2025-04-21
Reason
Benchmark
Josh Sullivan
Price Target
$100 → $74
2025-04-21
Maintains
Strong Buy
Reason
Benchmark lowered the firm's price target on Kaiser Aluminum to $74 from $100 and keeps a Buy rating on the shares. Aerospace OEM-exposed names such as Kaiser are broadly expected to deliver solid Q1 results, with the second half expected to be driven by ramping OEM production rates, the analyst tells investors in a preview. Tariffs are driving near-term uncertainty and consumer softness is raising recessions concerns, but the long-term aerospace replacement cycle remains, the analyst added.
Wolfe Research
Timna Tanners
Sell
to
Hold
Upgrades
n/a
2025-04-11
Reason
Wolfe Research
Timna Tanners
Price Target
n/a
2025-04-11
Upgrades
Sell
to
Hold
Reason
Wolfe Research analyst Timna Tanners upgraded Kaiser Aluminum to Peer Perform from Underperform and removed the firm's prior $61 price target. Shares have pulled back 50% from their year-ago peaks and while the firm sees continued risk from elevated leverage, new mill ramp up, and uncertain end market demand, it likes the company's second half ramp up of value-add new capacity, the analyst tells investors.
See All Ratings
Valuation Metrics
The current forward P/E ratio for Kaiser Aluminum Corp (KALU.O) is 13.50, compared to its 5-year average forward P/E of 26.91. For a more detailed relative valuation and DCF analysis to assess Kaiser Aluminum Corp 's fair value, click here.
Forward PE
The forward P/E ratio is a valuation metric that divides a company's current stock price by its estimated future earnings per share over the next 12 months.

Fair
5Y Average PE
26.91
Current PE
13.50
Overvalued PE
40.68
Undervalued PE
13.14
Forward EV/EBITDA
The forward EV/EBITDA ratio is a valuation metric that divides a company's enterprise value (EV) by its estimated future earnings before interest, taxes, depreciation, and amortization (EBITDA) over the next 12 months.

Undervalued
5Y Average EV/EBITDA
9.66
Current EV/EBITDA
8.00
Overvalued EV/EBITDA
11.10
Undervalued EV/EBITDA
8.21
Forward PS
The forward P/S ratio is a valuation metric that divides a company's current stock price by its estimated future sales (or revenue) per share over the next 12 months.

Fair
5Y Average PS
0.48
Current PS
0.39
Overvalued PS
0.68
Undervalued PS
0.29
Financials
Annual
Quarterly
FY2025Q2
YoY :
+6.43%
823.10M
Total Revenue
FY2025Q2
YoY :
+70.85%
38.10M
Operating Profit
FY2025Q2
YoY :
+648.39%
23.20M
Net Income after Tax
FY2025Q2
YoY :
+642.11%
1.41
EPS - Diluted
FY2025Q2
YoY :
+59.20%
-27.70M
Free Cash Flow
FY2025Q2
YoY :
+23.24%
8.59
Gross Profit Margin - %
FY2025Q2
YoY :
+605.00%
2.82
Net Margin - %
FY2025Q2
YoY :
-100.00%
N/A
ROIC
Trading Trends
Insider
Insiders are Neutral. There are no significant trading trends over the last month.
Sold
0-3
Months
0.0
USD
0
3-6
Months
0.0
USD
0
6-9
Months
0.0
USD
0
0-12
Months
0.0
USD
0
Bought
0-3
0
0.0
USD
Months
3-6
0
0.0
USD
Months
6-9
0
0.0
USD
Months
0-12
0
0.0
USD
Months
Hedge Fund
Hedge Funds are Neutral. There are no significant trading trends over the last quarter.
Sold
0-3
Months
0.0
Volume
0
3-6
Months
0.0
Volume
0
6-9
Months
0.0
Volume
0
0-12
Months
0.0
Volume
0
Bought
0-3
0
0.0
Volume
Months
3-6
0
0.0
Volume
Months
6-9
0
0.0
Volume
Months
0-12
0
0.0
Volume
Months
Congress Trading
Congress are Neutral. There are no significant trading trends over the last month.
Sold
0-3
Months
0.0
USD
0
3-6
Months
0.0
USD
0
6-9
Months
0.0
USD
0
0-12
Months
0.0
USD
0
Bought
0-3
0
0.0
USD
Months
3-6
0
0.0
USD
Months
6-9
0
0.0
USD
Months
0-12
0
0.0
USD
Months
Insider
Insiders are Neutral. There are no significant trading trends over the last month.
Sold
0-3
Months
0.0
USD
0
3-6
Months
0.0
USD
0
6-9
Months
0.0
USD
0
0-12
Months
0.0
USD
0
Bought
0-3
0
0.0
USD
Months
3-6
0
0.0
USD
Months
6-9
0
0.0
USD
Months
0-12
0
0.0
USD
Months
KALU News & Events
Events Timeline
2025-07-23 (ET)
2025-07-23
16:34:15
Kaiser Aluminum backs FY25 conversion revenue growth view 5%-10%

2025-07-23
16:33:30
Kaiser Aluminum reports Q2 adjusted EPS $1.21, consensus 74c

2025-04-23 (ET)
2025-04-23
16:34:49
Kaiser Aluminum sees FY25 converson revenue up 5%-10%

Sign Up For More Events
News
4.0
07-28BenzingaJP Morgan Maintains Neutral on Kaiser Aluminum, Raises Price Target to $82
8.0
07-25NASDAQ.COMWhy Kaiser Aluminum Is a Top 5 Metals Channel Dividend Stock (KALU)
9.5
07-23NASDAQ.COMKaiser Aluminum Corporation Q2 Income Climbs
Sign Up For More News
People Also Watch

EVRI
Everi Holdings Inc
14.240
USD
0.00%

XRX
Xerox Holdings Corp
5.705
USD
-4.12%

XPEL
Xpel Inc
34.140
USD
-1.27%

EVH
Evolent Health Inc
9.530
USD
-1.24%

GABC
German American Bancorp Inc
40.560
USD
+0.97%

NVGS
Navigator Holdings Ltd
16.390
USD
+1.05%

INVA
Innoviva Inc
18.695
USD
+0.84%

ECPG
Encore Capital Group Inc
37.830
USD
-1.33%

PZZA
Papa John's International Inc
42.040
USD
-2.37%

SAFT
Safety Insurance Group Inc
70.340
USD
+0.47%
FAQ

What is Kaiser Aluminum Corp (KALU) stock price today?
The current price of KALU is 80.53 USD — it has decreased -2.1 % in the last trading day.

What is Kaiser Aluminum Corp (KALU)'s business?

What is the price predicton of KALU Stock?

What is Kaiser Aluminum Corp (KALU)'s revenue for the last quarter?

What is Kaiser Aluminum Corp (KALU)'s earnings per share (EPS) for the last quarter?

What changes have occurred in the market's expectations for Kaiser Aluminum Corp (KALU)'s fundamentals?

How many employees does Kaiser Aluminum Corp (KALU). have?
