Intellectia LogoIntellectia
Product
Resources
Markets
Pricing
Log inTry for Free
Intellectia Logo
Log in
Intellectia Logo

Product

Features
Financial AI Agent
Stock Technical Analysis
Stock Monitor
Hedge Fund Tracker
Crypto Technical Analysis
AI Screener
Trading Strategies
AI Stock Picker
Swing Trading
Earnings Trading
Stock Chart Patterns
Daytrading Center

Resources

Learn
Blog
Earnings
Tutorial
Help Center
Company
About Us
Contact
Press
Reward Program
Partner Program
Dividend Calculator
Dividend Yield Calculator
Options Profit Calculator
Compare
TradingView
SeekingAlpha

Markets

Trending Stocks
Hot Crypto
Trending News
All Stocks
Pricing
Start for Free
  1. Home
  2. >
  3. Stock
  4. >
  5. GBX
stocks logo

GBX

-
Add to WatchlistAdvanced Chart
$
0.000
0(0.000%)1D
High
--
Open
--
VWAP
--
Vol
--
Mkt Cap
--
Low
--
Amount
--
EV/EBITDA(TTM)
--
Total Shares
--
EV
--
EV/OCF(TTM)
--
P/S(TTM)
--

Market Estimates

Earnings Estimates
Earnings Estimates
Revenue
YoY Chg
EPS
YoYChg
FY2025Q4
FY2026Q1
FY2026Q2
764.10M
-27.44%
1.180
-38.54%
812.17M
-7.28%
1.280
-25.58%
778.80M
+2.19%
1.230
-27.22%
Estimates Revision
The market is revising No Change the revenue expectations for The Greenbrier Companies, Inc. (GBX) for FY2025, with the revenue forecasts being adjusted by 0% over the past three months. During the same period, the stock price has changed by 16.82%.
Revenue Estimates for FY2025
No Change
down Image
0.00%
In Past 3 Month
EPS Estimates for FY2025
No Change
down Image
0.00%
In Past 3 Month
Stock Price
Go Up
up Image
+16.82%
In Past 3 Month
2 Analyst Rating
up Image0
Wall Street analysts forecast GBX stock price to rise over the next 12 months. According to Wall Street analysts, the average 1-year price target for GBX is 51.50 USD with a low forecast of 46.00 USD and a high forecast of 57.00  USD. However, analyst price targets are subjective and often lag stock prices, so investors should focus on the objective reasons behind analyst rating changes, which better reflect the company's fundamentals.
1 Buy
0 Hold
1 Sell
Hold
up Image0
Current: 48.420
sliders
Low
46.00
Averages
51.50
High
57.00
up Image0
Current: 48.420
sliders
Low
46.00
Averages
51.50
High
57.00
Susquehanna
Bascome Majors
Positive
maintain
$52 -> $57
2025-07-02
Reason
Susquehanna
Bascome Majors
Price Target
$52 -> $57
2025-07-02
maintain
Positive
Reason
Susquehanna analyst Bascome Majors raised the firm's price target on Greenbrier to $57 from $52 and keeps a Positive rating on the shares. The firm previewed its Q3 results where they see the company's F3Q earnings power fading into F4Q25 and early F2026, but see that run rate greater than prior expectations and far better than the company has performed at the bottom of other new railcar cycles.
Susquehanna
Bascome Majors
Buy
Maintains
$75 → $52
2025-04-08
Reason
Susquehanna
Bascome Majors
Price Target
$75 → $52
2025-04-08
Maintains
Buy
Reason
Susquehanna lowered the firm's price target on Greenbrier to $52 from $75 and keeps a Positive rating on the shares. The firm noted North American railcar OEMs avoided tariffs on Mexico production and the company is maintaining healthy margins despite soft demand. Still, this cloud of uncertainty should keep orders lower for longer, and they cut estimates to take F2026 from flattish to a large decline in 2026.
B of A Securities
Ken Hoexter
Sell
Maintains
$60 → $62
2025-01-09
Reason
B of A Securities
Ken Hoexter
Price Target
$60 → $62
2025-01-09
Maintains
Sell
Reason
B of A Securities
Ken Hoexter
Sell
Maintains
$42 → $50
2024-10-24
Reason
B of A Securities
Ken Hoexter
Price Target
$42 → $50
2024-10-24
Maintains
Sell
Reason
Susquehanna
Bascome Majors
Buy
Maintains
$63 → $65
2024-10-21
Reason
Susquehanna
Bascome Majors
Price Target
$63 → $65
2024-10-21
Maintains
Buy
Reason
See All Ratings

Valuation Metrics

The current forward P/E ratio for Greenbrier Companies Inc (GBX.N) is 9.65, compared to its 5-year average forward P/E of -1.38. For a more detailed relative valuation and DCF analysis to assess Greenbrier Companies Inc 's fair value, click here.
    Forward PE
    Forward EV/EBITDA
    Forward PS

Forward PE

The forward P/E ratio is a valuation metric that divides a company's current stock price by its estimated future earnings per share over the next 12 months.
StronglyUndervaluedUndervaluedFairOvervaluedStronglyOvervalueddotted line Image
N/A
5Y Average PE
-1.38
Current PE
9.65
Overvalued PE
118.27
Undervalued PE
-121.03

Forward EV/EBITDA

The forward EV/EBITDA ratio is a valuation metric that divides a company's enterprise value (EV) by its estimated future earnings before interest, taxes, depreciation, and amortization (EBITDA) over the next 12 months.
StronglyUndervaluedUndervaluedFairOvervaluedStronglyOvervalueddotted line Image
Fair
5Y Average EV/EBITDA
8.47
Current EV/EBITDA
7.45
Overvalued EV/EBITDA
10.01
Undervalued EV/EBITDA
6.93

Forward PS

The forward P/S ratio is a valuation metric that divides a company's current stock price by its estimated future sales (or revenue) per share over the next 12 months.
StronglyUndervaluedUndervaluedFairOvervaluedStronglyOvervalueddotted line Image
Fair
5Y Average PS
0.45
Current PS
0.49
Overvalued PS
0.57
Undervalued PS
0.32

Financials

Annual
Quarterly
N/A
Total Revenue
N/A
Operating Profit
N/A
Net Income after Tax
N/A
EPS - Diluted
N/A
Free Cash Flow
N/A
Gross Profit Margin - %
N/A
FCF Margin - %
N/A
Net Margin - %
N/A
ROIC

Trading Trends

    Insider
    Hedge Fund
    Congress Trading
Insider
Insiders areSelling! The selling amount has increased 520% over the last month.
Sold
Bought
Hedge Fund
Hedge Funds are Neutral. There are no significant trading trends over the last quarter.
Sold
Bought
Congress Trading
Congress are Neutral. There are no significant trading trends over the last month.
Sold
Bought
Insider
Insiders areSelling! The selling amount has increased 520% over the last month.
Sold
Bought

GBX News & Events

Events Timeline

(ET)
2025-07-02
12:00:53
Greenbrier rises 20.6%
select
2025-07-01 (ET)
2025-07-01
16:20:40
Greenbrier reaffirms FY25 revenue view $3.15B-$3.35B
select
2025-07-01
16:19:18
Greenbrier reports Q3 EPS $1.86 vs. $1.06 last year
select
Sign Up For More Events

News

Preview
8.0
07-15NASDAQ.COM
Ex-Dividend Reminder: Graham Holdings, Dime Community Bancshares and Greenbrier Companies
  • Upcoming Ex-Dividend Dates: On July 17, 2025, Graham Holdings Co. (GHC), Dime Community Bancshares Inc (DCOM), and Greenbrier Companies Inc (GBX) will trade ex-dividend, with respective dividends of $1.80, $0.25, and $0.32 scheduled for payment on August 7, 2025, and July 24, 2025.

  • Dividend Yield Expectations: The estimated annualized yields based on recent stock prices are 0.78% for GHC, 3.45% for DCOM, and 2.43% for GBX, reflecting the historical stability of these companies' dividends amidst fluctuating profits.

Preview
3.0
07-10NASDAQ.COM
Invest in These 5 Low Price-to-Sales Stocks Before They Take Off
  • Valuation Metrics for Investing: The price-to-sales (P/S) ratio is highlighted as a valuable tool for evaluating companies, especially those that are unprofitable or in early growth stages, providing insights into potential investment opportunities when combined with strong fundamentals.

  • Highlighted Companies: Several companies such as Hamilton Insurance Group, Greenbrier Companies, Signet Jewelers, Cognizant Technology Solutions, and PagSeguro Digital are identified as having low P/S ratios and strong growth potential, making them attractive options for investors.

Preview
4.0
07-04NASDAQ.COM
Greenbrier (GBX) Upgraded to Buy: Here's What You Should Know
  • Zacks Rank Upgrade: Greenbrier Companies (GBX) has been upgraded to a Zacks Rank #2 (Buy) due to a significant increase in earnings estimates, indicating a positive outlook for the company's stock price.

  • Earnings Estimate Impact: The correlation between rising earnings estimates and stock price movements suggests that Greenbrier's improved business fundamentals could lead to higher stock performance, making it a strong candidate for investment.

Sign Up For More News

People Also Watch

FAQ

arrow icon

What is Greenbrier Companies Inc (GBX) stock price today?

The current price of GBX is 48.42 USD — it has decreased -3.26 % in the last trading day.

arrow icon

What is Greenbrier Companies Inc (GBX)'s business?

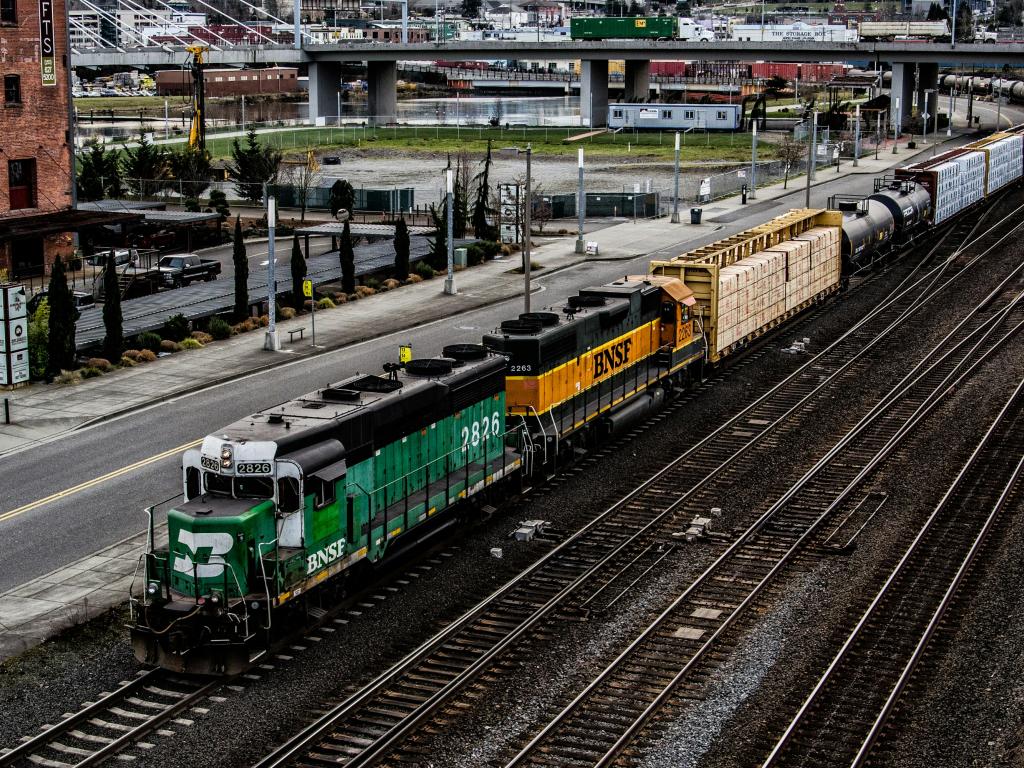
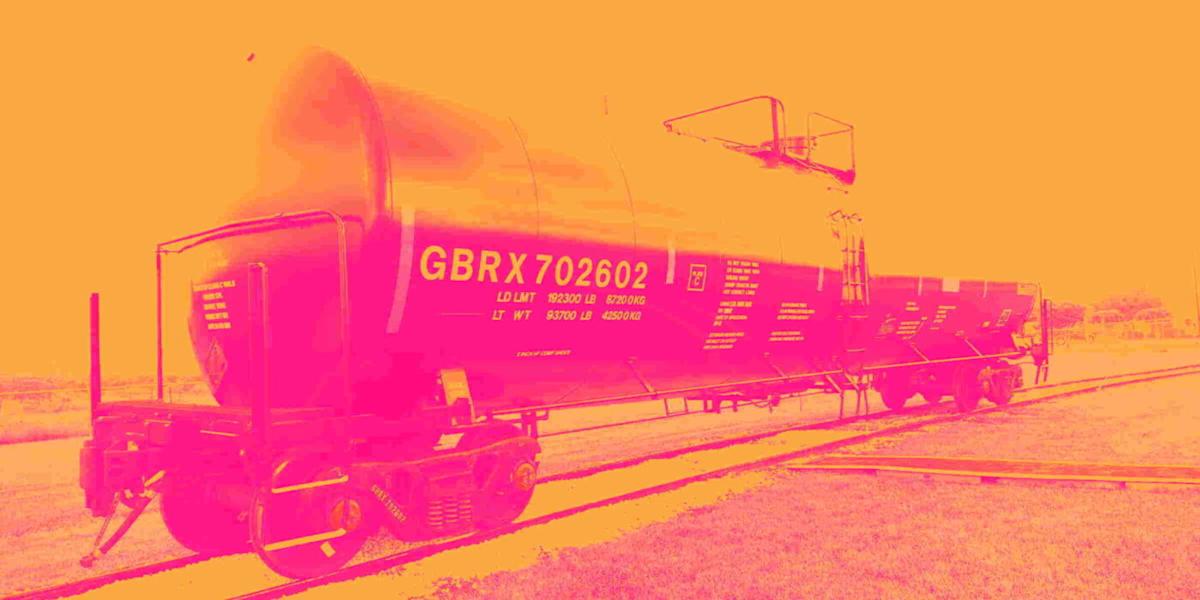
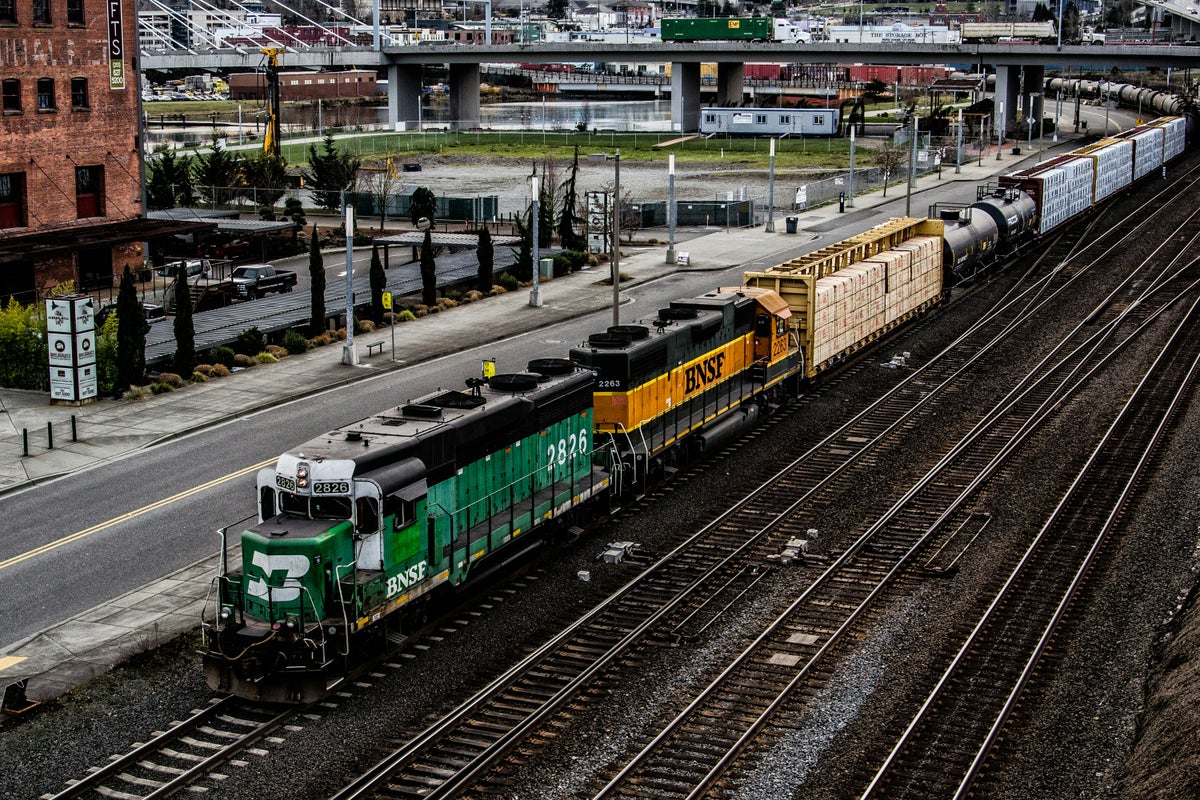
The Greenbrier Companies, Inc. is an international supplier of equipment and services to global freight transportation markets. The Company designs, builds and markets freight railcars in North America, Europe and Brazil. It is a provider of freight railcar wheel services, parts, maintenance and retrofitting services in North America through its maintenance services business unit. It owns a lease fleet of approximately 15,500 railcars that originate primarily from its manufacturing operations. The Company offers railcar management, regulatory compliance services and leasing services to railroads and other railcar owners in North America. Its products include freight railcars, tank cars, intermodal railcars, automotive and sustainable conversions. Its North American management services business offers a range of software and services that include railcar maintenance management, railcar accounting services, total fleet management, fleet logistics, administration and railcar re-marketing.

arrow icon

What is the price predicton of GBX Stock?

Wall Street analysts forecast GBX stock price to rise over the next 12 months. According to Wall Street analysts, the average 1-year price target for GBX is 51.50 USD with a low forecast of 46.00 USD and a high forecast of 57.00 USD. However, analyst price targets are subjective and often lag stock prices, so investors should focus on the objective reasons behind analyst rating changes, which better reflect the company's fundamentals.

arrow icon

What is Greenbrier Companies Inc (GBX)'s revenue for the last quarter?

Greenbrier Companies Inc revenue for the last quarter amounts to 842.70M USD, increased 2.74 % YoY.

arrow icon

What is Greenbrier Companies Inc (GBX)'s earnings per share (EPS) for the last quarter?

Greenbrier Companies Inc. EPS for the last quarter amounts to 1.87 USD, increased 76.42 % YoY.

arrow icon

What changes have occurred in the market's expectations for Greenbrier Companies Inc (GBX)'s fundamentals?

The market is revising No Change the revenue expectations for The Greenbrier Companies, Inc. (GBX) for FY2025, with the revenue forecasts being adjusted by 0% over the past three months. During the same period, the stock price has changed by 16.82%.
arrow icon

How many employees does Greenbrier Companies Inc (GBX). have?

Greenbrier Companies Inc (GBX) has 14200 emplpoyees as of July 19 2025.

arrow icon

What is Greenbrier Companies Inc (GBX) market cap?

Today GBX has the market capitalization of 1.55B USD.

Intellectia LogoIntellectiaIntellectia LogoIntellectia

Redefine Your Investment Decisions

TwitterTwitterYoutubeYoutubeQuoraQuoraDiscordDiscordLinkedinLinkedinTelegramTelegram

Copyright © 2025 Intellectia.AI. All Rights Reserved.

pci certified logo
Company
HomeContactAbout UsNews Release
Compare
TradingViewSeeking Alpha
Features
Financial AI AgentStock Technical AnalysisStock MonitorHedge Fund TrackerCrypto Technical AnalysisAI ScreenerDaytrading Center
Strategies
AI Stock PickerSwing TradingStock Chart PatternsEarnings Trading
Free Tools
Dividend CalculatorDividend Yield CalculatorOptions Profit Calculator
Resource
BlogTutorialEarningsTrending StocksCrypto MarketPartner ProgramTerms of UsePrivacy PolicySitemap
Start for Free