FXNC Overview
-
$
0.000
0.000(0.000%)
At close0.000(0.000%)Aft-market
ET
Loading chart...

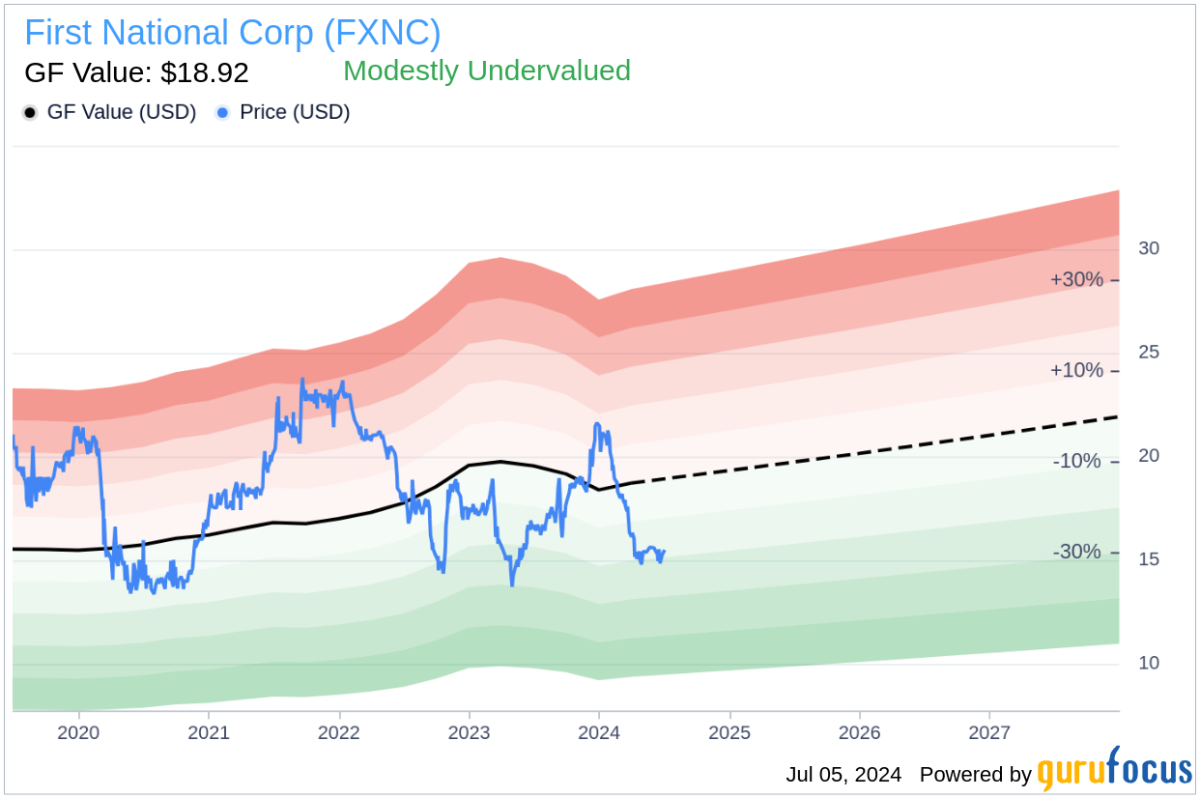
The current price of FXNC is 29.36 USD — it has increased 1.1
First National Corporation is a bank holding company for First Bank (the Bank), which is a commercial bank. The Bank offers loan, deposit, and wealth management products and services. Its loan products and services include consumer loans, residential mortgages, home equity loans and commercial loans. Deposit products and services include checking accounts, treasury management solutions, savings accounts, money market accounts, certificates of deposit and individual retirement accounts. Wealth management services include estate planning, investment management of assets, trustee under an agreement, trustee under a will, individual retirement accounts and estate settlement. Its customers include small and medium-sized businesses, individuals, estates, local governmental entities, and non-profit organizations. It operates over 33 branches throughout the Shenandoah Valley, central regions of Virginia, and the Richmond and Roanoke market areas.
Wall Street analysts forecast FXNC stock price to fall over the next 12 months. According to Wall Street analysts, the average 1-year price target for FXNC is USD with a low forecast of USD and a high forecast of USD. However, analyst price targets are subjective and often lag stock prices, so investors should focus on the objective reasons behind analyst rating changes, which better reflect the company's fundamentals.
First National Corp revenue for the last quarter amounts to 20.77M USD, increased 8.66
First National Corp. EPS for the last quarter amounts to 0.54 USD, increased 200.00
First National Corp (FXNC) has 308 emplpoyees as of June 21 2026.
Today FXNC has the market capitalization of 265.44M USD.