$
3.560
+0.02(0.565%)1D
  • Overview
  • Forecast
  • Valuation
  • Earnings
Line
Line
|
Candle
Candle
1D
5D
1M
3M
6M
YTD
1Y
5Y
High
3.690
Open
3.540
VWAP
3.55
Vol
892.01K
Mkt Cap
183.34M
Low
3.400
Amount
3.17M
EV/EBITDA(TTM)
7.28
Total Shares
52.02M
EV
459.78M
EV/OCF(TTM)
15.61
P/S(TTM)
0.41
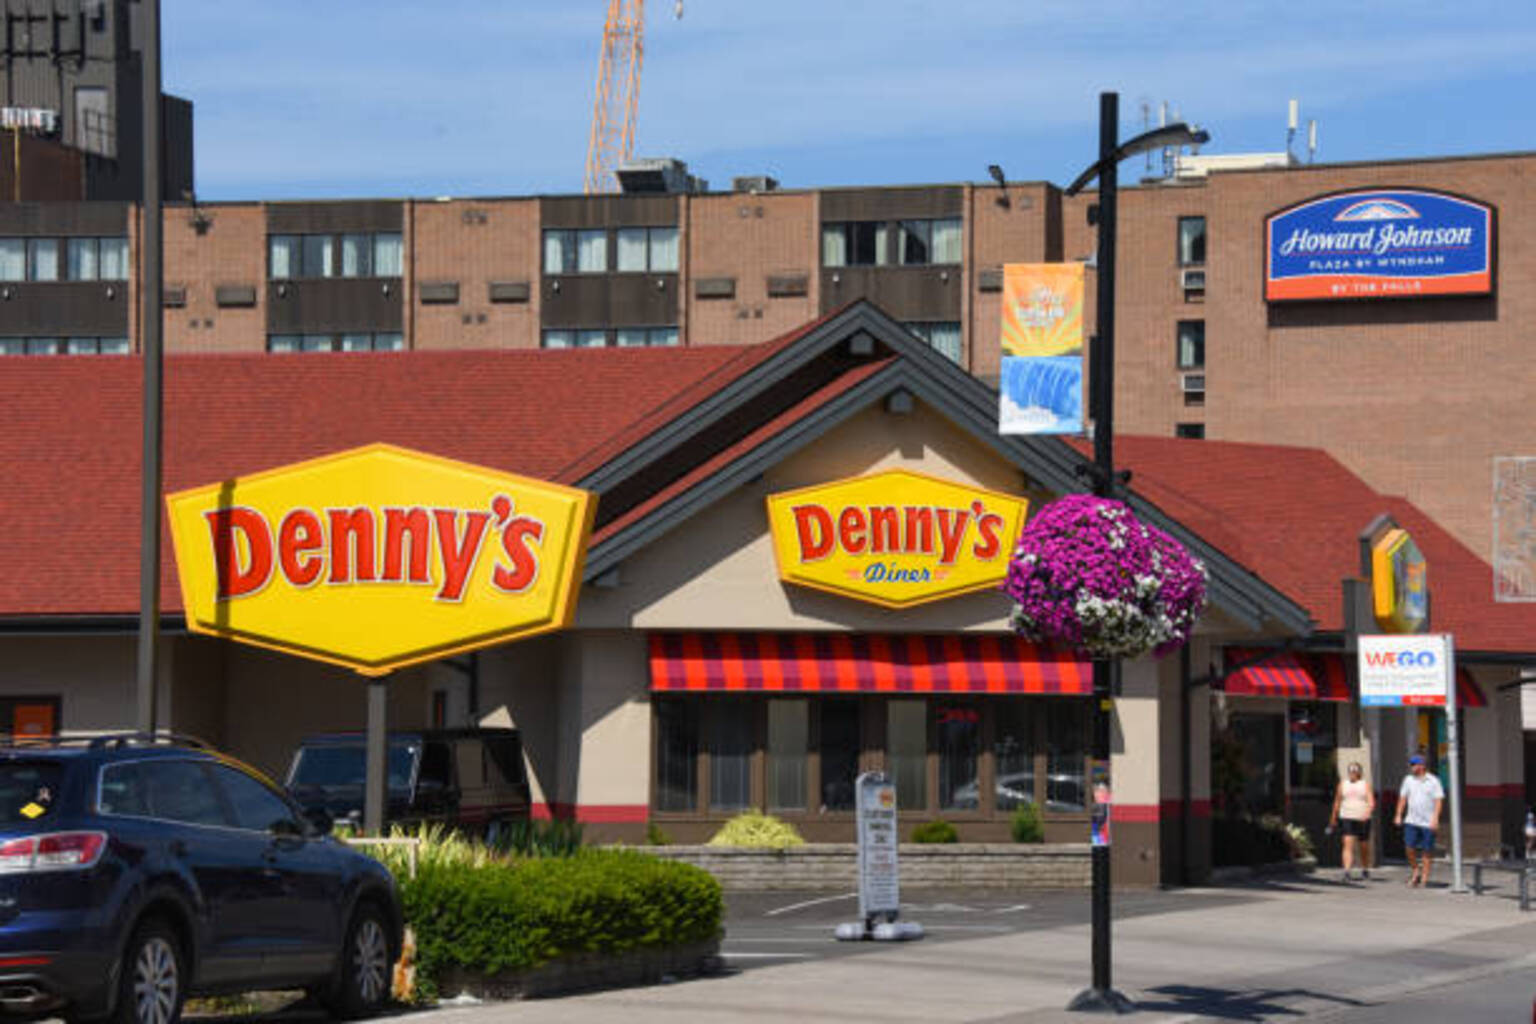
Denny's Corporation is a franchised full-service restaurant chain. The Company owns and operates the Denny’s brand (Denny’s) and the Keke’s Breakfast Cafe brand (Keke’s). It operates in two segments: Denny’s and Keke’s. It has approximately 1,568 restaurants, 1,493 of which were franchised/licensed restaurants and 75 of which were Company-operated. The Denny’s brand consists of over 1,499 franchised, licensed and company restaurants around the world, including 1,334 restaurants in the United States and 165 international restaurant locations. Denny’s offers a wide selection of lunch and dinner items, including entrees, burgers, sandwiches and salads, along with an assortment of appetizers and desserts. It has four dayparts, breakfast, lunch, dinner and late night. Keke’s is a daytime eatery dedicated to providing a breakfast experience. Keke’s brand consists of over 69 franchised and company restaurants in the United States. Keke’s also serves burgers, paninis, salads, and sandwiches.
Show More

Market Estimates

Earnings Estimates
Revenue
YoY Chg
EPS
YoYChg
FY2025Q3
FY2025Q4
FY2026Q1
117.22M
+4.89%
0.108
-22.89%
131.23M
+14.44%
0.157
+11.89%
118.53M
+6.18%
0.110
+37.35%
Estimates Revision
The market is revising Upward the revenue expectations for Denny's Corporation (DENN) for FY2025, with the revenue forecasts being adjusted by 1.35% over the past three months. During the same period, the stock price has changed by -8.95%.
Revenue Estimates for FY2025
Revise Upward
up Image
+1.35%
In Past 3 Month
EPS Estimates for FY2025
Revise Downward
down Image
-5.35%
In Past 3 Month
Stock Price
Go Down
down Image
-8.95%
In Past 3 Month
5 Analyst Rating
up Image
91.29% Upside
Wall Street analysts forecast DENN stock price to rise over the next 12 months. According to Wall Street analysts, the average 1-year price target for DENN is 6.81 USD with a low forecast of 6.00 USD and a high forecast of 8.00  USD. However, analyst price targets are subjective and often lag stock prices, so investors should focus on the objective reasons behind analyst rating changes, which better reflect the company's fundamentals.
4 Buy
1 Hold
0 Sell
Strong Buy
up Image
91.29% Upside
Current: 3.560
sliders
Low
6.00
Averages
6.81
High
8.00
Piper Sandler
Brian Mullan
Neutral
downgrade
$6 -> $4
2025-08-05
New
Reason
Piper Sandler analyst Brian Mullan lowered the firm's price target on Denny's to $4 from $6 and keeps a Neutral rating on the shares following quarterly results. The Q2 domestic systemwide same-store sales result was down 1.3% at the core Denny's brand, which is indicative of the tough operating environment for the Family Dining segment right now, the firm notes.
Citi
Buy
downgrade
$7
2025-04-24
Reason
Citi lowered the firm's price target on Denny's to $6.25 from $7 and keeps a Buy rating on the shares. The firm says expectations are "rightfully low" heading into the company's Q1 results amid soft sales trends, significant egg inflation and ongoing store closures. However, Citi still sees Denny's risk/reward as favorable at these levels.
Piper Sandler
Brian Mullan
Hold
Maintains
$7 → $6
2025-02-18
Reason
Wedbush
Nick Setyan
Buy
Maintains
$10 → $8.5
2025-02-13
Reason
Oppenheimer
Michael Tames
Buy
Maintains
$8 → $7
2025-02-13
Reason
Citigroup
Jon Tower
Strong Buy
Maintains
$8 → $7
2025-02-13
Reason
Citi analyst Jon Tower lowered the firm's price target on Denny's to $7 from $8 and keeps a Buy rating on the shares post the Q4 report. The firm says the company's momentum gained after a favorable Q4 pre-release "quickly reversed," with a "much choppier backdrop" in the balance of January and into February and border state weakness. However, the firm still sees the stock's risk/reward as favorable at these levels.

Valuation Metrics

The current forward P/E ratio for Denny's Corp (DENN.O) is 7.18, compared to its 5-year average forward P/E of 20.25. For a more detailed relative valuation and DCF analysis to assess Denny's Corp 's fair value, click here.

Forward PE

StronglyUndervaluedUndervaluedFairOvervaluedStronglyOvervalueddotted line Image
Undervalued
5Y Average PE
20.25
Current PE
7.18
Overvalued PE
31.09
Undervalued PE
9.42

Forward EV/EBITDA

StronglyUndervaluedUndervaluedFairOvervaluedStronglyOvervalueddotted line Image
Undervalued
5Y Average EV/EBITDA
12.58
Current EV/EBITDA
7.29
Overvalued EV/EBITDA
16.98
Undervalued EV/EBITDA
8.19

Forward PS

StronglyUndervaluedUndervaluedFairOvervaluedStronglyOvervalueddotted line Image
Undervalued
5Y Average PS
1.44
Current PS
0.38
Overvalued PS
2.14
Undervalued PS
0.75

Financials

Annual
Quarterly
FY2025Q2
YoY :
+1.49%
117.66M
Total Revenue
FY2025Q2
YoY :
-2.25%
10.66M
Operating Profit
FY2025Q2
YoY :
-30.77%
2.47M
Net Income after Tax
FY2025Q2
YoY :
-28.57%
0.05
EPS - Diluted
FY2025Q2
YoY :
-77.37%
2.07M
Free Cash Flow
FY2025Q2
YoY :
-0.52%
57.25
Gross Profit Margin - %
FY2025Q2
-1.22
FCF Margin - %
FY2025Q2
YoY :
-31.82%
2.10
Net Margin - %
FY2025Q2
13.45
ROIC

Trading Trends

Insider
Insiders are Neutral. There are no significant trading trends over the last month.
Sold
0-3
Months
0.0
USD
0
3-6
Months
0.0
USD
0
6-9
Months
0.0
USD
0
0-12
Months
0.0
USD
0
Bought
0-3
0
0.0
USD
Months
3-6
0
0.0
USD
Months
6-9
3
104.5K
USD
Months
0-12
0
0.0
USD
Months
Hedge Fund
Hedge Funds are Neutral. There are no significant trading trends over the last quarter.
Sold
0-3
Months
0.0
Volume
0
3-6
Months
0.0
Volume
0
6-9
Months
0.0
Volume
0
0-12
Months
0.0
Volume
0
Bought
0-3
0
0.0
Volume
Months
3-6
0
0.0
Volume
Months
6-9
0
0.0
Volume
Months
0-12
0
0.0
Volume
Months
Congress Trading
Congress are Neutral. There are no significant trading trends over the last month.
Sold
0-3
Months
0.0
USD
0
3-6
Months
0.0
USD
0
6-9
Months
0.0
USD
0
0-12
Months
0.0
USD
0
Bought
0-3
0
0.0
USD
Months
3-6
0
0.0
USD
Months
6-9
0
0.0
USD
Months
0-12
0
0.0
USD
Months

DENN News & Events

Events Timeline

2025-08-04 (ET)
2025-08-04
16:36:48
Denny's backs FY25 adjusted EBITDA view $80M-$85M
select
2025-08-04
16:35:11
Denny's reports Q2 adjusted EPS 9c, consensus 11c
select
2025-05-05 (ET)
2025-05-05
16:22:57
Denny's sees FY25 adjusted EBITDA $80M-$85M
select
Sign Up For More Events

News

9.5
08-05NASDAQ.COM
PinnedDenny's (DENN) Q2 EPS Falls 31%
9.5
08-05Newsfilter
PinnedDenny's Corporation (DENN) Q2 2025 Earnings Call Transcript
9.5
08-05NASDAQ.COM
PinnedHere's What Key Metrics Tell Us About Denny's (DENN) Q2 Earnings
Sign Up For More News

FAQ

arrow icon

What is Denny's Corp (DENN) stock price today?

The current price of DENN is 3.56 USD — it has increased 0.56 % in the last trading day.

arrow icon

What is Denny's Corp (DENN)'s business?

arrow icon

What is the price predicton of DENN Stock?

arrow icon

What is Denny's Corp (DENN)'s revenue for the last quarter?

arrow icon

What is Denny's Corp (DENN)'s earnings per share (EPS) for the last quarter?

arrow icon

What changes have occurred in the market's expectations for Denny's Corp (DENN)'s fundamentals?

arrow icon

How many employees does Denny's Corp (DENN). have?

arrow icon

What is Denny's Corp (DENN) market cap?