COHU Overview
-
$
0.000
0.000(0.000%)
At close0.000(0.000%)Aft-market
ET
Loading chart...

The current price of COHU is 69.4 USD — it has increased 6.04
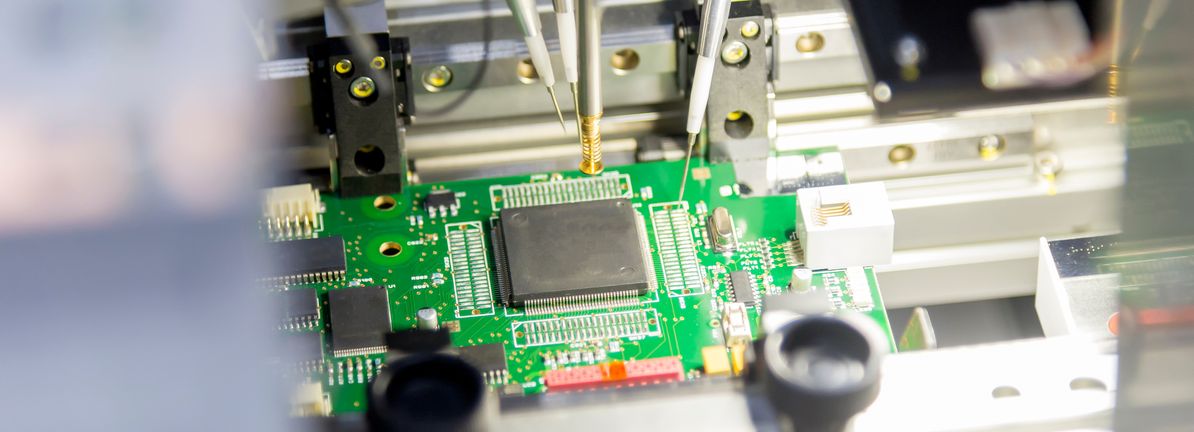
Cohu, Inc. is a supplier of semiconductor test automation and interface solutions, and a provider of semiconductor test equipment, inspection and metrology solutions, and software analytics to optimize semiconductor manufacturing yield and productivity. It offers a comprehensive suite of equipment, interface solutions, software, spares and services designed to address the evolving requirements of global semiconductor manufacturers. Its products support customers across computing & networking, automotive, industrial, mobile and consumer electronics markets. Its systems are designed to support smart manufacturing initiatives, including interface with robotics, automated guided vehicles (AGVs), overhead transport systems (OHTs), and automated mobile robots (AMRs) to reduce manual handling and enhance workplace safety. Its product lines include Test Automation, Inspection and Metrology, Semiconductor Automated Test Equipment (ATE), Interface Solutions, Software Analytics, and Services.
Wall Street analysts forecast COHU stock price to rise over the next 12 months. According to Wall Street analysts, the average 1-year price target for COHU is32.33 USD with a low forecast of 30.00 USD and a high forecast of 35.00 USD. However, analyst price targets are subjective and often lag stock prices, so investors should focus on the objective reasons behind analyst rating changes, which better reflect the company's fundamentals.
Cohu Inc revenue for the last quarter amounts to 125.12M USD, increased 29.26
Cohu Inc. EPS for the last quarter amounts to -0.26 USD, decreased -60.61
Cohu Inc (COHU) has 2857 emplpoyees as of June 21 2026.
Today COHU has the market capitalization of 3.27B USD.