
CMC
Commercial Metals Co
Line
|
Candle
1D
5D
1M
3M
6M
YTD
1Y
5Y
High
60.130
Open
59.510
VWAP
59.45
Vol
923.93K
Mkt Cap
6.59B
Low
59.050
Amount
54.93M
EV/EBITDA(TTM)
8.56
Total Shares
114.99M
EV
6.90B
EV/OCF(TTM)
9.65
P/S(TTM)
0.87
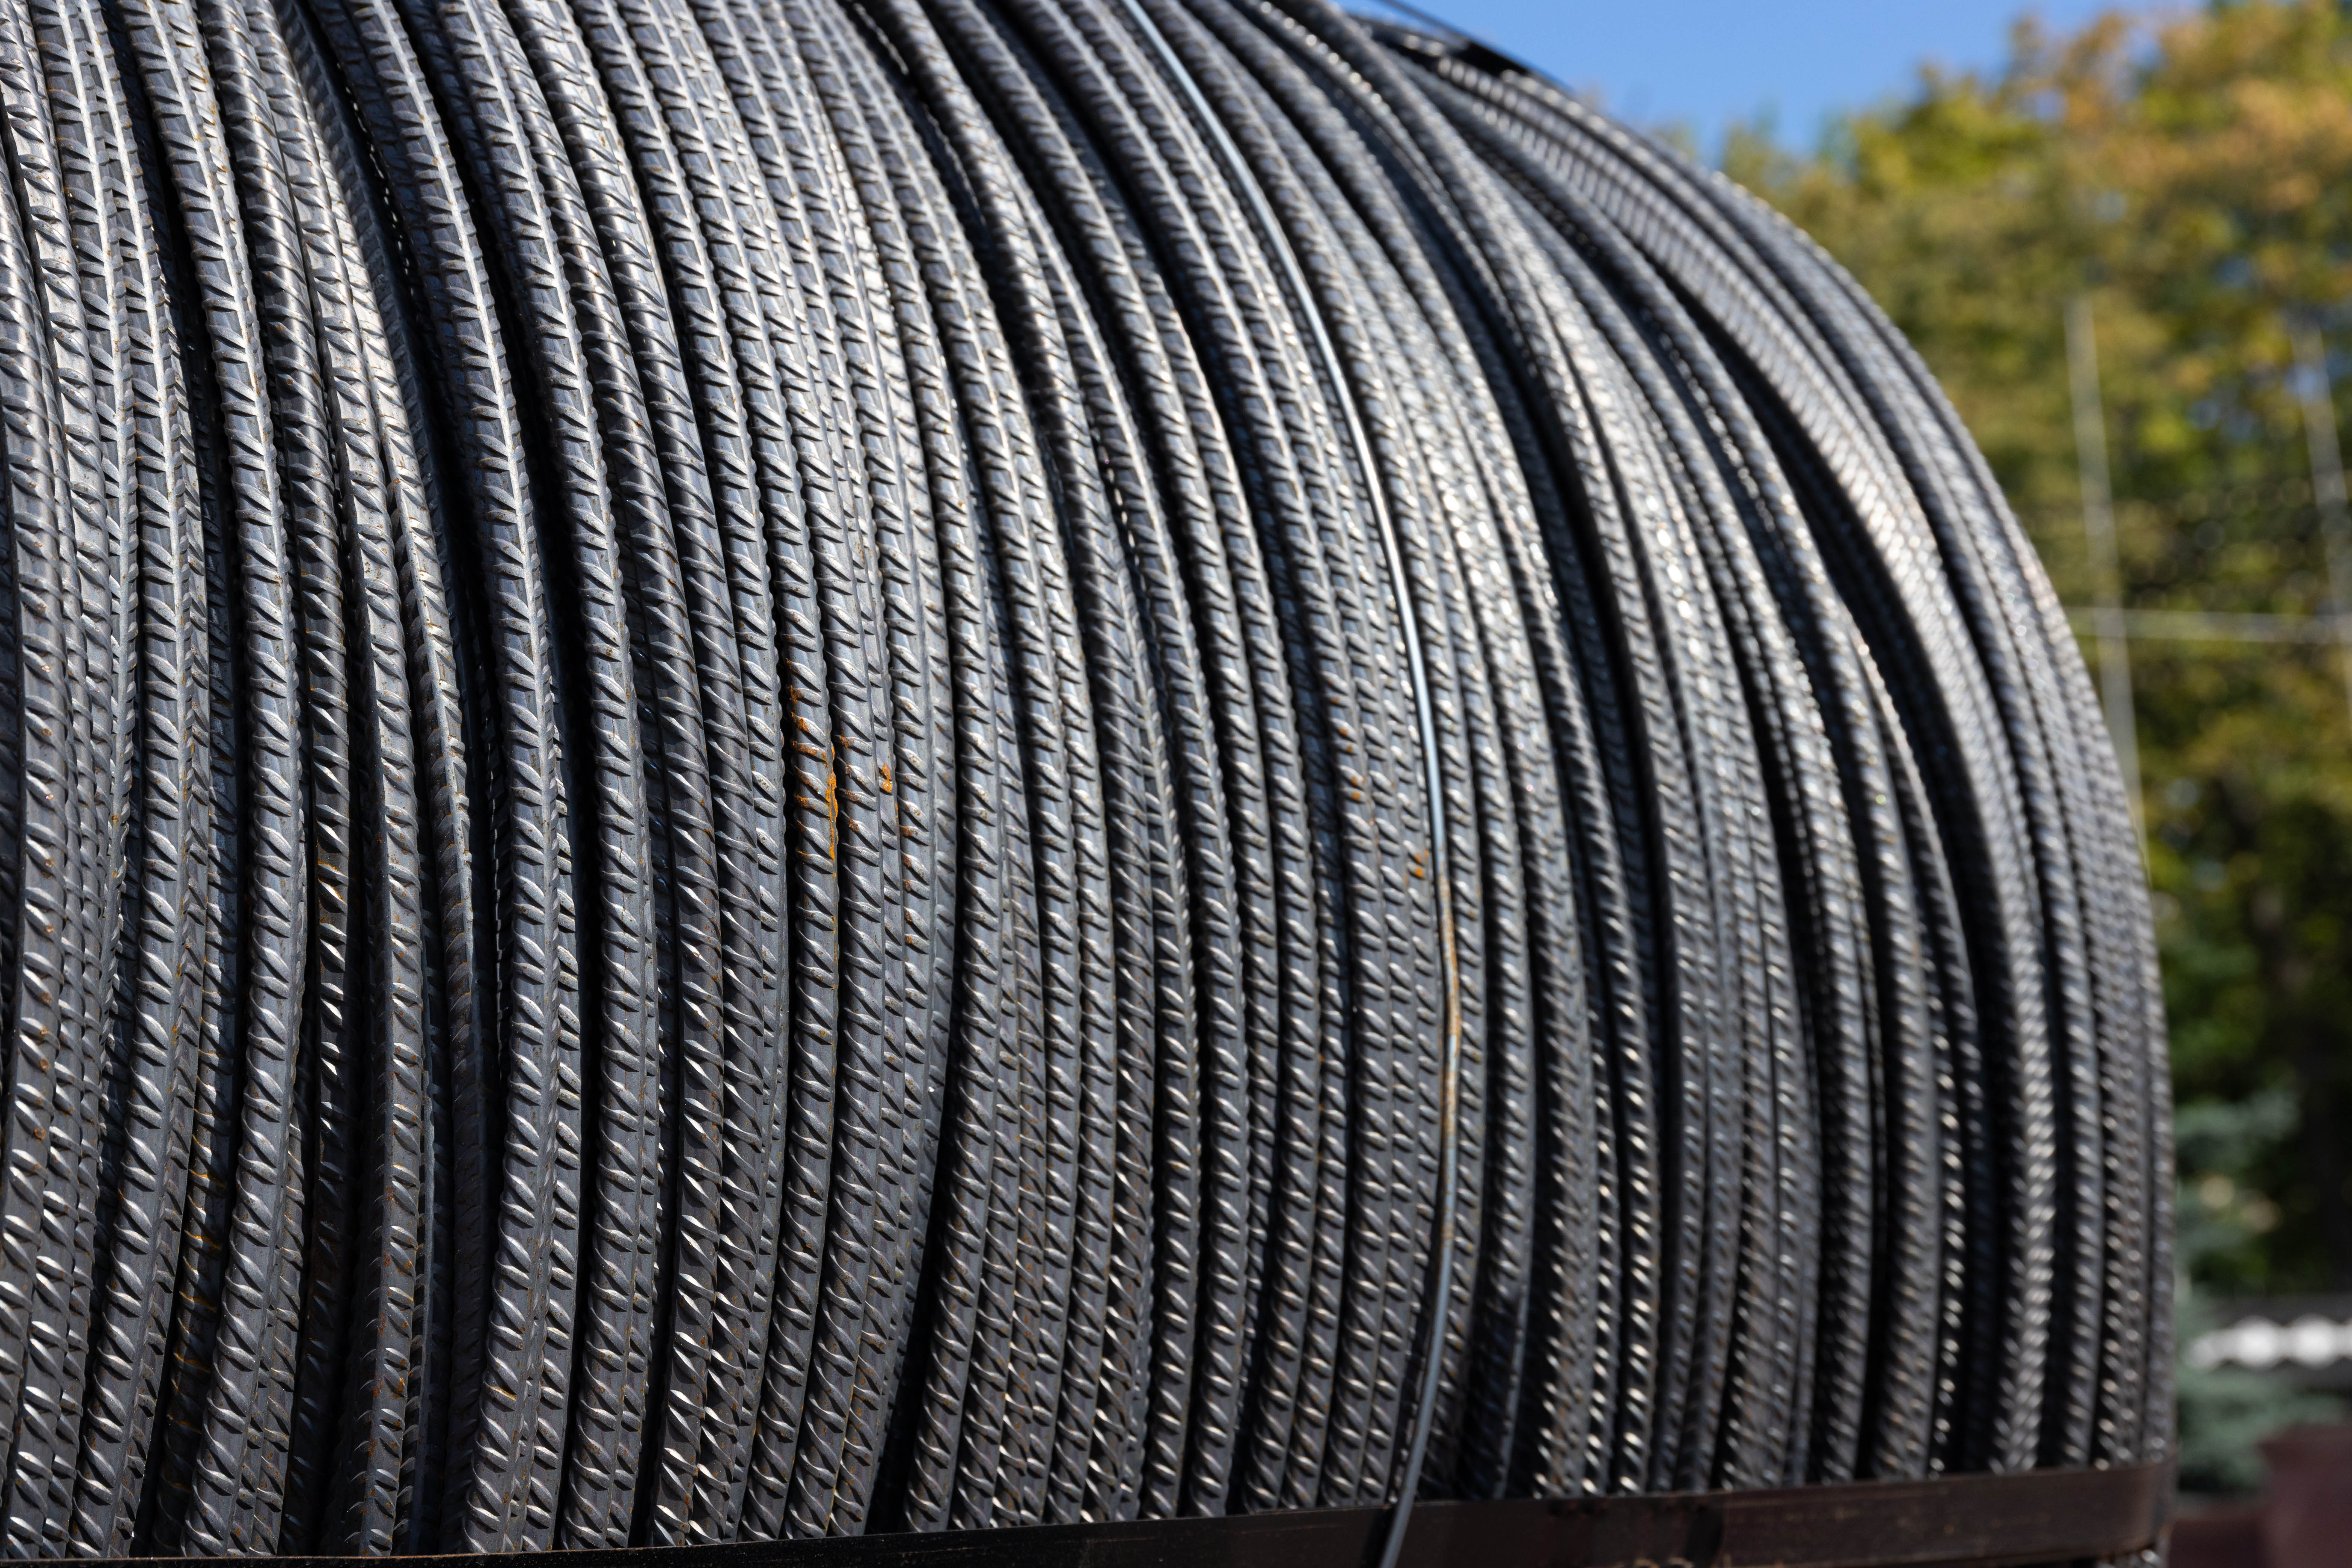
Commercial Metals Company is engaged in offering products and technologies to meet the critical reinforcement needs of the global construction sector. The Company’s solutions support construction across a wide variety of applications, including infrastructure, non-residential, residential, industrial, and energy generation, and transmission. Its segments include North America Steel Group, Europe Steel Group and the Emerging Businesses Group. The North America Steel Group segment provides a diverse offering of products and solutions to support the construction sector. The Europe Steel Group segment is composed of a vertically integrated network of recycling facilities, an EAF mini mill and fabrication operations located in Poland. The Emerging Businesses Group segment's portfolio consists of its construction services products, Tensar products and solutions and its impact metals, and performance reinforcing steel products.
Show More
Market Estimates
Earnings Estimates
Revenue
YoY Chg
EPS
YoYChg
FY2026Q1
FY2026Q2
FY2026Q3
2.07B
+8.46%
1.535
+96.77%
2.01B
+14.31%
1.190
+357.55%
2.28B
+13.03%
1.541
+108.28%
Estimates Revision
The market is revising Upward the revenue expectations for Commercial Metals Company (CMC) for FY2026, with the revenue forecasts being adjusted by 3.37% over the past three months. During the same period, the stock price has changed by 17.89%.
Revenue Estimates for FY2026
Revise Upward

+3.37%
In Past 3 Month
EPS Estimates for FY2026
Revise Upward

+30.39%
In Past 3 Month
Stock Price
Go Up

+17.89%
In Past 3 Month
9 Analyst Rating
Wall Street analysts forecast CMC stock price to rise over the next 12 months. According to Wall Street analysts, the average 1-year price target for CMC is 66.78 USD with a low forecast of 62.00 USD and a high forecast of 76.00 USD. However, analyst price targets are subjective and often lag stock prices, so investors should focus on the objective reasons behind analyst rating changes, which better reflect the company's fundamentals.
5 Buy
4 Hold
0 Sell
Moderate Buy
Current: 59.360
Low
62.00
Averages
66.78
High
76.00
Current: 59.360
Low
62.00
Averages
66.78
High
76.00
Morgan Stanley
Equal Weight -> Overweight
upgrade
$68
2025-10-24
Reason
Morgan Stanley
Price Target
$68
2025-10-24
upgrade
Equal Weight -> Overweight
Reason
Morgan Stanley upgraded Commercial Metals to Overweight from Equal Weight with a price target of $68, up from $57.50. The firm increased its steel price forecasts saying the 50% tariffs remain intact nearly five months after implementation. U.S. mills will continue to benefit from higher prices in the near term, but "soft" demand and potential Canada and Mexico trade deals limit price upside for now, the analyst tells investors in a research note. Morgan Stanley cites the completion of Commercial Metals' upcoming acquisitions that remove an M&A overhang for the upgrade.
Goldman Sachs
Mike Harris
Buy
maintain
$69 -> $76
2025-10-23
Reason
Goldman Sachs
Mike Harris
Price Target
$69 -> $76
2025-10-23
maintain
Buy
Reason
Goldman Sachs analyst Mike Harris raised the firm's price target on Commercial Metals to $76 from $69 and keeps a Buy rating on the shares post the fiscal Q3 report. The firm updated the company's model to reflect improving margins and operating leverage.
Jefferies
Christopher LaFemina
Buy -> Hold
downgrade
$70
2025-10-22
Reason
Jefferies
Christopher LaFemina
Price Target
$70
2025-10-22
downgrade
Buy -> Hold
Reason
Jefferies analyst Christopher LaFemina downgraded Commercial Metals to Hold from Buy with an unchanged price target of $70. The firm cites valuation and its near-term preference for flat-rolled steel producers for the downgrade. Commercial Metals shares are at a year-to-date high following the company's announced second acquisition of a precast concrete solutions' supplier last week, the analyst tells investors in a research note. Jefferies says the company's net debt will "meaningfully increase" following the closing of its recent transactions, and shareholder returns should slow as a result.
JPMorgan
Bill Peterson
Neutral
maintain
$63 -> $64
2025-10-20
Reason
JPMorgan
Bill Peterson
Price Target
$63 -> $64
2025-10-20
maintain
Neutral
Reason
JPMorgan analyst Bill Peterson raised the firm's price target on Commercial Metals to $64 from $63 and keeps a Neutral rating on the shares post the fiscal Q4 report. The company's fiscal Q1 outlook is below expectations, the analyst tells investors in a research note.
Citi
Neutral -> Buy
upgrade
$60 -> $65
2025-10-16
Reason
Citi
Price Target
$60 -> $65
2025-10-16
upgrade
Neutral -> Buy
Reason
Citi upgraded Commercial Metals to Buy from Neutral with a price target of $65, up from $60. The firm is positive on the stock's "emerging free cash flow / deleveraging story" following its transformational concrete acquisitions, the analyst tells investors in a research note. Commercial Metals also has incremental upside from the updated EU import policy and also remains directly exposed to bullish U.S. construction megatrends, Citi added.
Wells Fargo
Overweight
maintain
$61 -> $64
2025-09-19
Reason
Wells Fargo
Price Target
$61 -> $64
2025-09-19
maintain
Overweight
Reason
Wells Fargo raised the firm's price target on Commercial Metals to $64 from $61 and keeps an Overweight rating on the shares. The firm views Commercial Metals' announced concrete product deal as a compelling, easily digestible acquisition with a pathway to expanding more asset-light, higher-margin products.
See All Ratings
Valuation Metrics
The current forward P/E ratio for Commercial Metals Co (CMC.N) is 9.99, compared to its 5-year average forward P/E of 9.63. For a more detailed relative valuation and DCF analysis to assess Commercial Metals Co 's fair value, click here.
Forward PE
The forward P/E ratio is a valuation metric that divides a company's current stock price by its estimated future earnings per share over the next 12 months.

Fair
5Y Average PE
9.63
Current PE
9.99
Overvalued PE
12.86
Undervalued PE
6.40
Forward EV/EBITDA
The forward EV/EBITDA ratio is a valuation metric that divides a company's enterprise value (EV) by its estimated future earnings before interest, taxes, depreciation, and amortization (EBITDA) over the next 12 months.

Fair
5Y Average EV/EBITDA
5.46
Current EV/EBITDA
5.98
Overvalued EV/EBITDA
6.49
Undervalued EV/EBITDA
4.43
Forward PS
The forward P/S ratio is a valuation metric that divides a company's current stock price by its estimated future sales (or revenue) per share over the next 12 months.

N/A
5Y Average PS
0.83
Current PS
59.36
Overvalued PS
4.22
Undervalued PS
-2.55
Financials
Annual
Quarterly
FY2025Q4
YoY :
+5.93%
2.11B
Total Revenue
FY2025Q4
YoY :
+36.47%
212.59M
Operating Profit
FY2025Q4
YoY :
+46.04%
151.78M
Net Income after Tax
FY2025Q4
YoY :
+45.56%
1.31
EPS - Diluted
FY2025Q4
YoY :
-23.70%
206.29M
Free Cash Flow
FY2025Q4
YoY :
+14.83%
18.58
Gross Profit Margin - %
FY2025Q4
YoY :
-44.90%
4.00
FCF Margin - %
FY2025Q4
YoY :
+37.81%
7.18
Net Margin - %
FY2025Q4
YoY :
-77.53%
2.18
ROIC
Trading Trends
Insider
Insiders are Neutral. There are no significant trading trends over the last month.
Sold
0-3
Months
0.0
USD
0
3-6
Months
0.0
USD
0
6-9
Months
0.0
USD
0
0-12
Months
0.0
USD
0
Bought
0-3
1
100.0K
USD
Months
3-6
0
0.0
USD
Months
6-9
2
394.7K
USD
Months
0-12
0
0.0
USD
Months
Hedge Fund
Hedge Funds are Neutral. There are no significant trading trends over the last quarter.
Sold
0-3
Months
0.0
Volume
0
3-6
Months
0.0
Volume
0
6-9
Months
0.0
Volume
0
0-12
Months
0.0
Volume
0
Bought
0-3
0
0.0
Volume
Months
3-6
0
0.0
Volume
Months
6-9
0
0.0
Volume
Months
0-12
0
0.0
Volume
Months
Congress Trading
Congress are Neutral. There are no significant trading trends over the last month.
Sold
0-3
Months
0.0
USD
0
3-6
Months
0.0
USD
0
6-9
Months
0.0
USD
0
0-12
Months
0.0
USD
0
Bought
0-3
0
0.0
USD
Months
3-6
0
0.0
USD
Months
6-9
0
0.0
USD
Months
0-12
0
0.0
USD
Months
Insider
Insiders are Neutral. There are no significant trading trends over the last month.
Sold
0-3
Months
0.0
USD
0
3-6
Months
0.0
USD
0
6-9
Months
0.0
USD
0
0-12
Months
0.0
USD
0
Bought
0-3
1
100.0K
USD
Months
3-6
0
0.0
USD
Months
6-9
2
394.7K
USD
Months
0-12
0
0.0
USD
Months
CMC News & Events
Events Timeline
2025-10-16 (ET)
2025-10-16
07:15:01
Commercial Metals CEO reports Q1 results align with Q4 performance.
2025-10-16
07:13:35
Commercial Metals announces Q4 adjusted EPS of $1.37, surpassing consensus estimate of $1.34
2025-10-16
06:50:03
Commercial Metals to purchase Foley Products for $1.84 billion
Sign Up For More Events
News
3.0
10-31NASDAQ.COMReasons Why Fast-Growing Commercial Metals (CMC) Is an Excellent Option for Value Investors
6.0
10-25NASDAQ.COMMorgan Stanley Raises Rating on Commercial Metals (CMC)
6.0
10-24BenzingaMorgan Stanley Boosts Commercial Metals Rating to Overweight and Increases Price Target to $68
Sign Up For More News
People Also Watch

QXO
QXO Inc
17.670
USD
-0.51%

SIGI
Selective Insurance Group Inc
75.340
USD
-0.86%

QTWO
Q2 Holdings Inc
61.760
USD
+1.51%

LTH
Life Time Group Holdings Inc
24.730
USD
+0.57%

BF.A
Brown-Forman Corp
27.120
USD
+1.92%

UPST
Upstart Holdings Inc
47.520
USD
+5.69%

LUMN
Lumen Technologies Inc
10.280
USD
-0.58%

TX
Ternium SA
36.030
USD
+1.78%

REYN
Reynolds Consumer Products Inc
24.440
USD
-4.38%

SQM
Sociedad Quimica y Minera de Chile SA
48.990
USD
+1.58%
FAQ
What is Commercial Metals Co (CMC) stock price today?
The current price of CMC is 59.36 USD — it has decreased -0.9 % in the last trading day.


