Intellectia LogoIntellectia
Product
Resources
Markets
News
Partner Program
Pricing
Log inTry for Free
Intellectia Logo
Log in
Intellectia Logo

Product

Features
Financial AI Agent
Stock Technical Analysis
Stock Monitor
Hedge Fund Tracker
AI Screener
Trading Strategies
AI Stock Picker
Swing Trading
Quant AI
Stock Chart Patterns
Daytrading Center
AI Earnings Prediction
Whales Auto Tracker
Backtesting Playground

Resources

Learn
Blog
Earnings
Tutorial
Help Center
Company
About Us
Contact
Press
Reward Program
Partner Program
Tools
Dividend Calculator
Dividend Yield Calculator
Options Profit Calculator
Compare
TradingView
SeekingAlpha

Markets

Trending Stocks
Hot Crypto
Trending News
All Stocks

News

Trading News
Overview
Top News
Daily Market Brief
Earnings
Latest
Newswire
Stock News
Crypto News
Monitor News
Partner ProgramPricing
Start for Free
  1. Home
  2. >
  3. Stock
  4. >
  5. CEVA
stocks logo

CEVA

-
collectAdd to Watchlistadvanced chartAdvanced Chart
$
0.000
0(0.000%)1D
collectadvanced chart
    Overview
    Forecast
    Valuation
    Earnings
High
--
Open
--
VWAP
--
Vol
--
Mkt Cap
--
Low
--
Amount
--
EV/EBITDA(TTM)
--
Total Shares
--
EV
--
EV/OCF(TTM)
--
P/S(TTM)
--
Intellectia AI SwingMax

Market Estimates

Earnings Estimates
Earnings Estimates
Revenue
YoY Chg
EPS
YoYChg
FY2025Q4
FY2026Q1
FY2026Q2
31.16M
+6.62%
0.191
+74%
29.11M
+20.06%
0.126
+109.33%
29.64M
+15.42%
0.130
+86%
Estimates Revision
The market is revising Upward the revenue expectations for CEVA, Inc. (CEVA) for FY2025, with the revenue forecasts being adjusted by 0.16% over the past three months. During the same period, the stock price has changed by 0.00%.
Revenue Estimates for FY2025
Revise Upward
up Image
+0.16%
In Past 3 Month
EPS Estimates for FY2025
Revise Upward
up Image
+0.76%
In Past 3 Month
Stock Price
No Change
down Image
0.00%
In Past 3 Month
Wall Street analysts forecast CEVA stock price to rise over the next 12 months. According to Wall Street analysts, the average 1-year price target for CEVA is 36.00 USD with a low forecast of 33.00 USD and a high forecast of 40.00 USD. However, analyst price targets are subjective and often lag stock prices, so investors should focus on the objective reasons behind analyst rating changes, which better reflect the company's fundamentals.
5 Analyst Rating
Wall Street analysts forecast CEVA stock price to rise over the next 12 months. According to Wall Street analysts, the average 1-year price target for CEVA is 36.00 USD with a low forecast of 33.00 USD and a high forecast of 40.00 USD. However, analyst price targets are subjective and often lag stock prices, so investors should focus on the objective reasons behind analyst rating changes, which better reflect the company's fundamentals.
5 Buy
0 Hold
0 Sell
Strong Buy
Current: 22.730
sliders
Low
33.00
Averages
36.00
High
40.00
Current: 22.730
sliders
Low
33.00
Averages
36.00
High
40.00
Barclays
Tavy Rosner
maintain
$30 -> $35
2025-11-11
Reason
Barclays
Tavy Rosner
Price Target
$30 -> $35
2025-11-11
maintain
Reason
Barclays analyst Tavy Rosner raised the firm's price target on Ceva to $35 from $30 and keeps an Overweight rating on the shares.
Roth Capital
Buy
upgrade
$30 -> $35
2025-11-10
Reason
Roth Capital
Price Target
$30 -> $35
2025-11-10
upgrade
Buy
Reason
Roth Capital raised the firm's price target on Ceva to $35 from $30 and keeps a Buy rating on the shares. The company's Q3 results topped estimates, and the firm is encouraged by broad end market royalty growth and robust licensing results, the analyst tells investors in a research note. The growing NeuPro AI IP licensing contribution bodes well for the secular growth opportunity, the firm added.
Oppenheimer
Martin Yang
Outperform
to
NULL
downgrade
$40 -> $33
2025-05-09
Reason
Oppenheimer
Martin Yang
Price Target
$40 -> $33
2025-05-09
downgrade
Outperform
to
NULL
Reason
Oppenheimer analyst Martin Yang lowered the firm's price target on Ceva to $33 from $40 and keeps an Outperform rating on the shares. The firm notes Ceva's Q1 2025 revenue of $24.2M missed guidance low-end of $25.5M and consensus estimate of $26.6M. The weakness was attributed to lower handset shipment and a slower ramp at an industrial customer.
Barclays
Overweight
downgrade
$40 -> $30
2025-05-08
Reason
Barclays
Price Target
$40 -> $30
2025-05-08
downgrade
Overweight
Reason
Barclays lowered the firm's price target on Ceva to $30 from $40 and keeps an Overweight rating on the shares. The company's results missed on sales growth and management lowered year-end guidance due near-term macro and tariffs uncertainty, the analyst tells investors in a research note. The firm cut the target to reflect near-term uncertainty around end user consumer demand.
Rosenblatt
Kevin Cassidy
Strong Buy
Maintains
$45
2025-04-23
Reason
Rosenblatt
Kevin Cassidy
Price Target
$45
2025-04-23
Maintains
Strong Buy
Reason
Barclays
Tavy Rosner
Buy
Maintains
$34 → $40
2025-02-14
Reason
Barclays
Tavy Rosner
Price Target
$34 → $40
2025-02-14
Maintains
Buy
Reason
See All Ratings

Valuation Metrics

The current forward P/E ratio for CEVA Inc (CEVA.O) is 37.13, compared to its 5-year average forward P/E of 78.68. For a more detailed relative valuation and DCF analysis to assess CEVA Inc 's fair value, click here.
  • Forward PE
  • Forward EV/EBITDA
  • Forward PS

Forward PE

The forward P/E ratio is a valuation metric that divides a company's current stock price by its estimated future earnings per share over the next 12 months.
StronglyUndervaluedUndervaluedFairOvervaluedStronglyOvervalueddotted line Image
N/A
5Y Average PE
78.68
Current PE
37.13
Overvalued PE
162.66
Undervalued PE
-5.31

Forward EV/EBITDA

The forward EV/EBITDA ratio is a valuation metric that divides a company's enterprise value (EV) by its estimated future earnings before interest, taxes, depreciation, and amortization (EBITDA) over the next 12 months.
StronglyUndervaluedUndervaluedFairOvervaluedStronglyOvervalueddotted line Image
N/A
5Y Average EV/EBITDA
-65.02
Current EV/EBITDA
0.00
Overvalued EV/EBITDA
177.97
Undervalued EV/EBITDA
-308.01

Forward PS

The forward P/S ratio is a valuation metric that divides a company's current stock price by its estimated future sales (or revenue) per share over the next 12 months.
StronglyUndervaluedUndervaluedFairOvervaluedStronglyOvervalueddotted line Image
N/A
5Y Average PS
6.13
Current PS
0.00
Overvalued PS
8.03
Undervalued PS
4.23
AI Stock Picker
AI Stock Picker

Financials

Annual
Quarterly
N/A
Total Revenue
N/A
Operating Profit
N/A
Net Income after Tax
N/A
EPS - Diluted
N/A
Free Cash Flow
N/A
Gross Profit Margin - %
N/A
FCF Margin - %
N/A
Net Margin - %
N/A
ROIC

Trading Trends

  • Insider
  • Hedge Fund
  • Congress Trading
Insider
Insiders are Neutral. There are no significant trading trends over the last month.
Sold
Bought
Hedge Fund
Hedge Funds are Neutral. There are no significant trading trends over the last quarter.
Sold
Bought
Congress Trading
Congress are Neutral. There are no significant trading trends over the last month.
Sold
Bought
Insider
Insiders are Neutral. There are no significant trading trends over the last month.
Sold
Bought
Financial AI Agent
Financial AI Agent

CEVA News & Events

Events Timeline

(ET)
2025-12-01
07:21:00
Loop Capital Initiates Coverage of Ceva with Buy Rating and $28 Price Target
select
2025-11-19 (ET)
2025-11-19
06:12:11
Ceva 3M Shares Offered in Secondary Market at $19.50 Each
select
2025-11-17 (ET)
2025-11-17
17:52:17
Ceva reveals plan for 3M common stock share offering
select
Sign Up For More Events

News

[object Object]
Preview
8.5
11-29Yahoo Finance
CEVA (CEVA) Launches Underwritten Public Offering
  • Public Offering Announcement: CEVA, Inc. has initiated an underwritten public offering of 3,000,000 shares, with an option for underwriters to purchase an additional 450,000 shares, aiming to finance acquisitions and general corporate purposes.

  • Q3 2025 Financial Performance: The company reported total revenues of $28.4 million for Q3 2025, a rise from $27.2 million in Q3 2024, with notable increases in licensing and royalty revenues, surpassing expectations for both revenue and non-GAAP diluted income per share.

  • Future Revenue Expectations: For Q4 2025, CEVA anticipates total revenues between $29 million and $33 million, indicating continued growth prospects.

  • Investment Considerations: While CEVA is recognized as a promising investment, the article suggests that certain AI stocks may offer better upside potential and lower risk, encouraging readers to explore alternative investment opportunities.

[object Object]
Preview
8.5
11-19SeekingAlpha
Ceva Semiconductor Sets Price for 3 Million Share Offering at $19.50 per Share
  • Public Offering Announcement: Ceva has announced an underwritten public offering of 3,000,000 shares of its common stock priced at $19.50 per share.

  • Expected Proceeds: The gross proceeds from this offering are anticipated to be approximately $58.5 million, all of which will be sold by Ceva.

[object Object]
Preview
8.5
11-19Newsfilter
CEVA REVEALS PRICING FOR UNDERWRITTEN PUBLIC OFFERING OF COMMON STOCK
  • Public Offering Announcement: Ceva, Inc. has priced a public offering of 3,000,000 shares of common stock at $19.50 per share, aiming to raise approximately $58.5 million before expenses, with a closing date expected on November 20, 2025.

  • Use of Proceeds: The funds raised will enhance Ceva's financial flexibility and may be used for acquisitions, investments in complementary technologies, working capital, capital expenditures, and share repurchases.

  • Underwriters Involved: J.P. Morgan is the lead book-running manager, with UBS, TD Cowen, and Stifel also participating as book-running managers, while several firms are acting as co-managers for the offering.

  • Forward-Looking Statements: The press release includes forward-looking statements regarding market conditions and the anticipated use of proceeds, cautioning that actual results may differ due to various risks and uncertainties.

Sign Up For More News

People Also Watch

FAQ

arrow icon

What is CEVA Inc (CEVA) stock price today?

The current price of CEVA is 22.73 USD — it has increased 2.99 % in the last trading day.

arrow icon

What is CEVA Inc (CEVA)'s business?

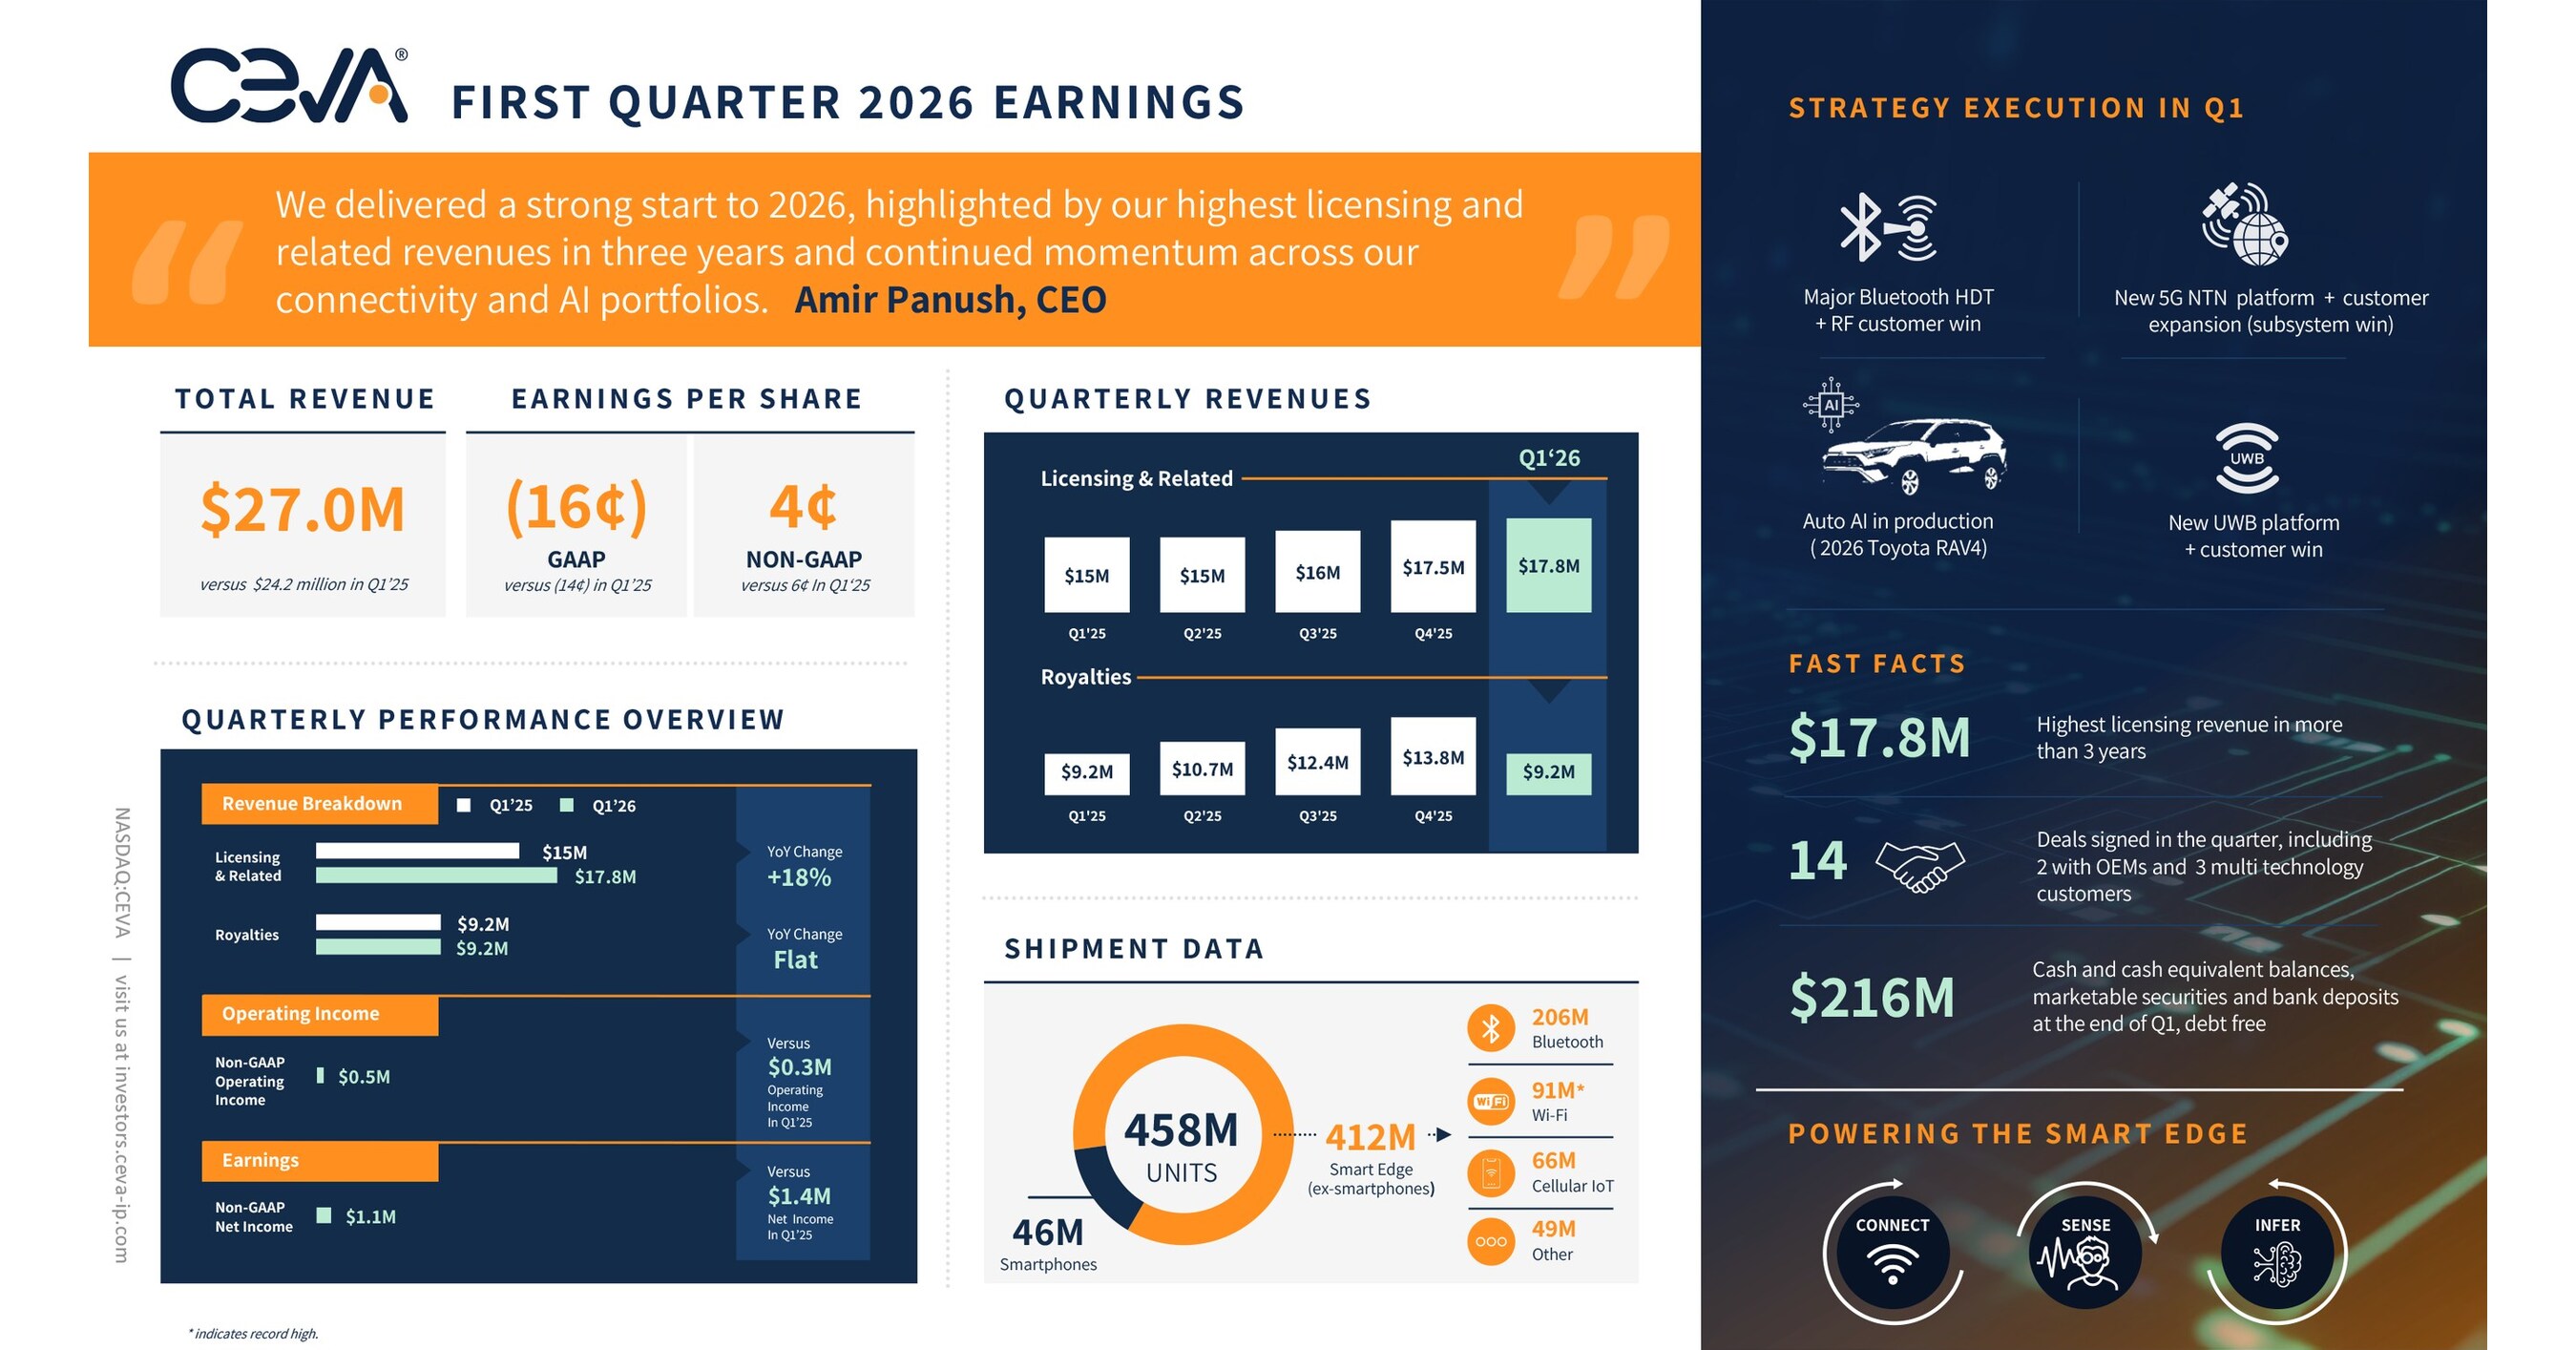
Ceva, Inc. is a licensor of silicon and software intellectual property (IP). The Company addresses the requirements of the consumer, industrial, infrastructure, automotive, mobile and PC markets by designing and licensing a range of processors, platforms, software and solutions which streamline the design of products for developing a variety of application specific solutions that address the connect, sense and infer use cases of smart edge devices. The Company's connect products include 5G/5G-A Baseband Platform (PentaG2), OpenRAN Platform, Cellular Internet of Things (IoT) (Ceva-Waves DragonFly) and Ultra-Wideband Platform (Ceva-Waves UWB). Its sense products include Vision/AI DSP, Audio and Control DSP, Neural-network-based noise cancellation, and Spatial Audio & Head Tracking. Its infer products include NPU IP for Generative AI, NPU IP for Embedded AI and AI SDK. It delivers its platforms, AI and sensor fusion DSPs and NPUs in the form of a hardware description language definition.

arrow icon

What is the price predicton of CEVA Stock?

Wall Street analysts forecast CEVA stock price to rise over the next 12 months. According to Wall Street analysts, the average 1-year price target for CEVA is 36.00 USD with a low forecast of 33.00 USD and a high forecast of 40.00 USD. However, analyst price targets are subjective and often lag stock prices, so investors should focus on the objective reasons behind analyst rating changes, which better reflect the company's fundamentals.

arrow icon

What is CEVA Inc (CEVA)'s revenue for the last quarter?

CEVA Inc revenue for the last quarter amounts to 28.38M USD, increased 4.33 % YoY.

arrow icon

What is CEVA Inc (CEVA)'s earnings per share (EPS) for the last quarter?

CEVA Inc. EPS for the last quarter amounts to -0.10 USD, increased 66.67 % YoY.

arrow icon

What changes have occurred in the market's expectations for CEVA Inc (CEVA)'s fundamentals?

The market is revising Upward the revenue expectations for CEVA, Inc. (CEVA) for FY2025, with the revenue forecasts being adjusted by 0.16% over the past three months. During the same period, the stock price has changed by 0.00%.
arrow icon

How many employees does CEVA Inc (CEVA). have?

CEVA Inc (CEVA) has 428 emplpoyees as of December 05 2025.

arrow icon

What is CEVA Inc (CEVA) market cap?

Today CEVA has the market capitalization of 614.11M USD.

Intellectia LogoIntellectiaIntellectia LogoIntellectia

Redefine Your Investment Decisions

TwitterTwitterYoutubeYoutubeQuoraQuoraDiscordDiscordLinkedinLinkedinTelegramTelegram
AppStoreGooglePlay

Copyright © 2025 Intellectia.AI. All Rights Reserved.

pci certified logo
Company
HomeContactAbout UsNews Release
Compare
TradingViewSeeking Alpha
Features
Financial AI AgentStock Technical AnalysisStock MonitorHedge Fund TrackerAI ScreenerDaytrading Center
Strategies
AI Stock PickerSwing TradingStock Chart PatternsEarnings TradingDaytrading CenterAI Earnings PredictionQuant AIWhales Auto TrackerBacktesting Playground
Free Tools
Dividend CalculatorDividend Yield CalculatorOptions Profit Calculator
Resource
BlogTutorialEarningsTrending StocksCrypto MarketPartner ProgramTerms of UsePrivacy PolicySecuritySitemap
Start for Free