

KBWB, GS, BK, STT: Warning on ETF Withdrawals
Written by Emily J. Thompson, Senior Investment Analyst
Updated: Oct 28 2025
0mins


Source: NASDAQ.COM
KBWB Share Price Analysis: KBWB's share price is currently at $77.18, with a 52-week low of $51.125 and a high of $80.035, indicating a strong performance within its trading range.
Understanding ETFs: Exchange-traded funds (ETFs) function like stocks, allowing investors to buy and sell "units" that can be created or destroyed based on demand, impacting the underlying assets.
Monitoring ETF Flows: Weekly monitoring of shares outstanding helps identify ETFs with significant inflows (new units created) or outflows (units destroyed), which can affect the individual components of the ETFs.
Disclaimer on Views: The opinions expressed in the article are those of the author and do not necessarily represent the views of Nasdaq, Inc.
Trade with 70% Backtested Accuracy
Stop guessing "Should I Buy GS?" and start using high-conviction signals backed by rigorous historical data.
Sign up today to access powerful investing tools and make smarter, data-driven decisions.
Analyst Views on GS
Wall Street analysts forecast GS stock price to fall
12 Analyst Rating
5 Buy
7 Hold
0 Sell
Moderate Buy
Current: 1021.000

Low
604.00
Averages
951.45
High
1100
Current: 1021.000
Low
604.00
Averages
951.45
High
1100
About GS
The Goldman Sachs Group, Inc. is a global financial institution that delivers a range of financial services to a large and diversified client base that includes corporations, financial institutions, governments and individuals. Its segments include Global Banking & Markets, Asset & Wealth Management and Platform Solutions. The Global Banking & Markets segment offers a range of services, including financing, advisory services, risk distribution, and hedging for its institutional and corporate clients. It facilitates client transactions and makes markets in fixed income, equity, currency and commodity products. The Asset & Wealth Management segment manages assets and offers investment products across all asset classes to a diverse set of clients. It also provides investing and wealth advisory solutions. The Platform Solutions segment includes consumer platforms, such as partnerships offering credit cards and point-of-sale financing, and transaction banking and other platform businesses.
About the author

Emily J. Thompson
Emily J. Thompson, a Chartered Financial Analyst (CFA) with 12 years in investment research, graduated with honors from the Wharton School. Specializing in industrial and technology stocks, she provides in-depth analysis for Intellectia’s earnings and market brief reports.

Deposit Account Rates Decline, Lock in Competitive CD Returns

- Current CD Rates: Short-term CDs (6 to 12 months) currently offer rates around 4% APY, with the highest at 4.10% for a 14-month CD from Marcus by Goldman Sachs, indicating opportunities for competitive returns despite declining rates.
- Historical Rate Trends: Since 2009, CD rates have significantly decreased, particularly after the 2008 financial crisis when the average one-year CD rate fell to about 1%, reflecting the impact of economic slowdown and Federal Reserve rate cuts.
- Impact of Economic Policy: The COVID-19 pandemic in 2020 led to emergency rate cuts by the Fed, resulting in record low CD rates; however, subsequent inflation prompted the Fed to hike rates 11 times between 2022 and 2023, driving CD rates higher.
- Choosing the Best CD: When selecting a CD, it’s crucial to consider not only the APY but also the term length, type of financial institution, and account terms to align with personal financial goals and maximize returns.
See More
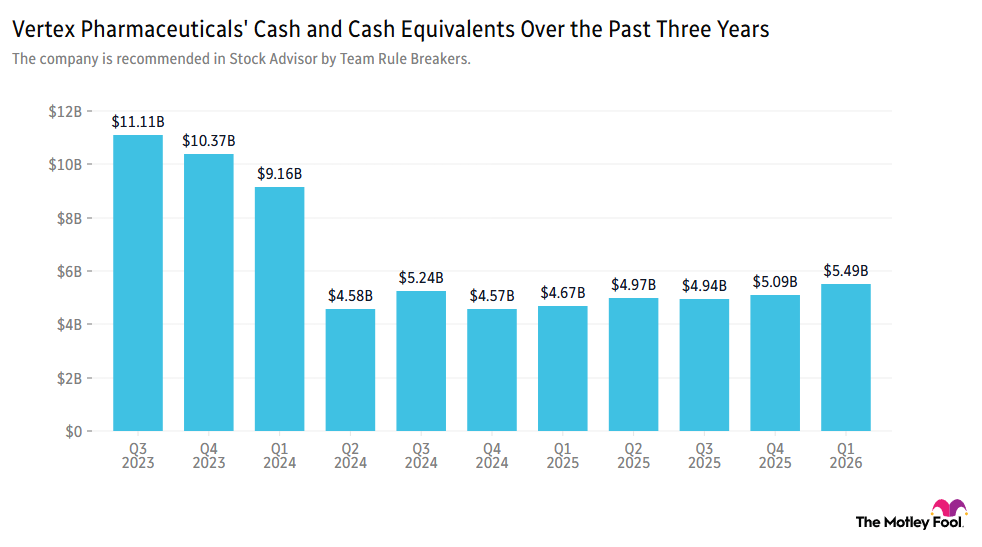
Vertex Acquires Crinetics for $10 Billion to Expand Rare Disease Portfolio


- Acquisition of Crinetics: Vertex Pharmaceuticals is acquiring Crinetics Pharmaceuticals for $10 billion, aiming to expand its business into endocrine diseases, with the potential to add up to $5 billion in annual revenue over the long term, although the market reacted negatively in the short term, pushing the stock down about 2%.
- Strategic Fit: Vertex CEO Reshma Kewalramani praised the acquisition as an excellent strategic fit, as Crinetics focuses on serious diseases in specialty markets with significant unmet needs, and it is expected to contribute revenue immediately through the ongoing launch of the Palsonify medicine.
- Revenue Growth Potential: The growing demand for therapeutics in endocrine diseases provides Vertex with a clear runway for double-digit revenue growth in the coming years, with Crinetics in the portfolio further solidifying its market position.
- Strong Market Performance: Since February 2022, Vertex's stock has outperformed the S&P 500 by 45%, demonstrating strong investor appeal, particularly in the current market environment.
See More

Meta's Plans to Compete in Cloud Computing Market Impact Neocloud Providers

- Stock Price Volatility: Following news of Meta's plans to enter the cloud computing market, CoreWeave's stock plummeted nearly 14% in a single day, while Nebius dropped 17%, reflecting market concerns about the future prospects of both companies, especially with Meta as a customer.
- Massive Contract Expansion: CoreWeave expanded its agreement with Meta in April 2023 to provide cloud computing capacity through 2032, valued at $21 billion, while Nebius announced in March it would provide $12 billion in cloud capacity, showcasing the strong collaborative potential in the AI data center sector.
- Sustained Demand Growth: Despite the competitive threat from Meta, demand for AI data centers from CoreWeave and Nebius remains robust, with CoreWeave noting that its 2026 capacity is largely sold out and 30% of its $99.4 billion revenue backlog comes from foundational AI labs, indicating urgent market demand for their services.
- Investment Opportunity Emerges: Although Meta's plans could impact CoreWeave and Nebius, the demand for AI data centers far exceeds supply, making the current stock price pullback a buying opportunity, particularly as CoreWeave's price-to-sales ratio is only 6.6, indicating potential investment value.
See More

Meta Enters AI Data Center Market, Impact on CoreWeave and Nebius
- Increased Competition: Meta's plan to enter the AI data center market led to a 14% and 17% drop in CoreWeave and Nebius shares respectively, indicating market concerns over new competition that could impact future revenue growth for both companies.
- Shifting Customer Dynamics: CoreWeave's agreement with Meta has been extended to 2032, valued at $21 billion, while Nebius has committed to providing $12 billion in cloud computing capacity, highlighting the importance of their business relationships despite increased competition.
- Strong Demand Continues: CoreWeave's AI cloud platform demand is nearing saturation for 2026, with 30% of its $99.4 billion revenue backlog coming from foundational AI labs, showcasing its robust market position and growth potential.
- Optimistic Industry Outlook: According to Goldman Sachs, U.S. data center power demand is projected to double to 66GW by 2027, indicating that the demand for AI data centers will continue to grow, positioning CoreWeave and Nebius to benefit from this trend.
See More
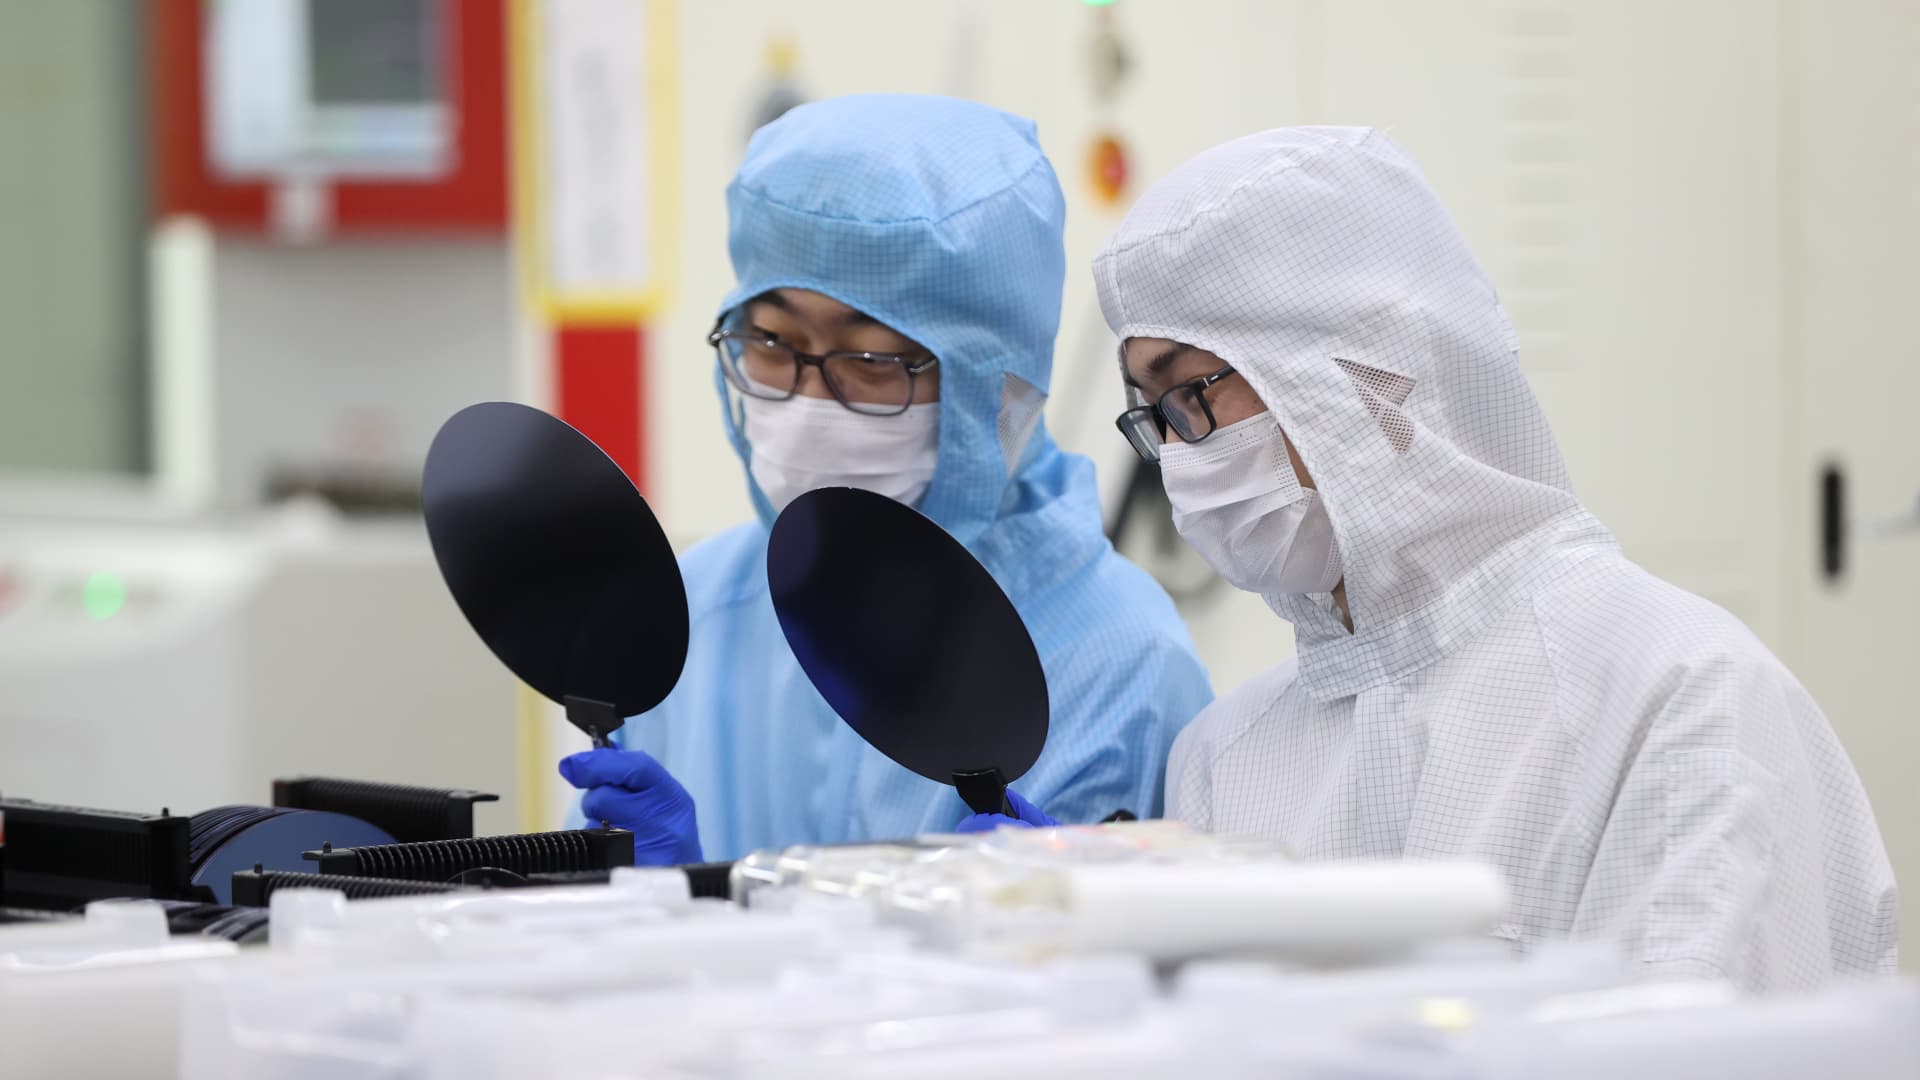
BlackRock: U.S. Stocks to Dominate AI Race

- Investment Preference: BlackRock Investment Institute maintains a neutral stance on Chinese stocks while staying overweight on U.S. equities, indicating a belief that U.S. companies will dominate the AI race, reflecting confidence in the U.S. market.
- Market Performance Comparison: While the Nasdaq Composite has gained over 12% this year, China's ChiNext index has surged more than 20%, indicating strong short-term performance of Chinese tech stocks; however, the overall MSCI China index has fallen over 10%, reflecting market uncertainty.
- Policy Support and Challenges: Beijing has rolled out policies to support domestic AI development amid U.S. restrictions on high-end technology, yet the unclear profitability of companies in the context of slower economic growth and fierce competition highlights market complexities.
- Investment Opportunities: BlackRock analysts see potential in physical AI, emphasizing the integration of AI technology into hardware, while recommending stocks exposed to scarce industry inputs, showcasing a focus on infrastructure investments.
See More
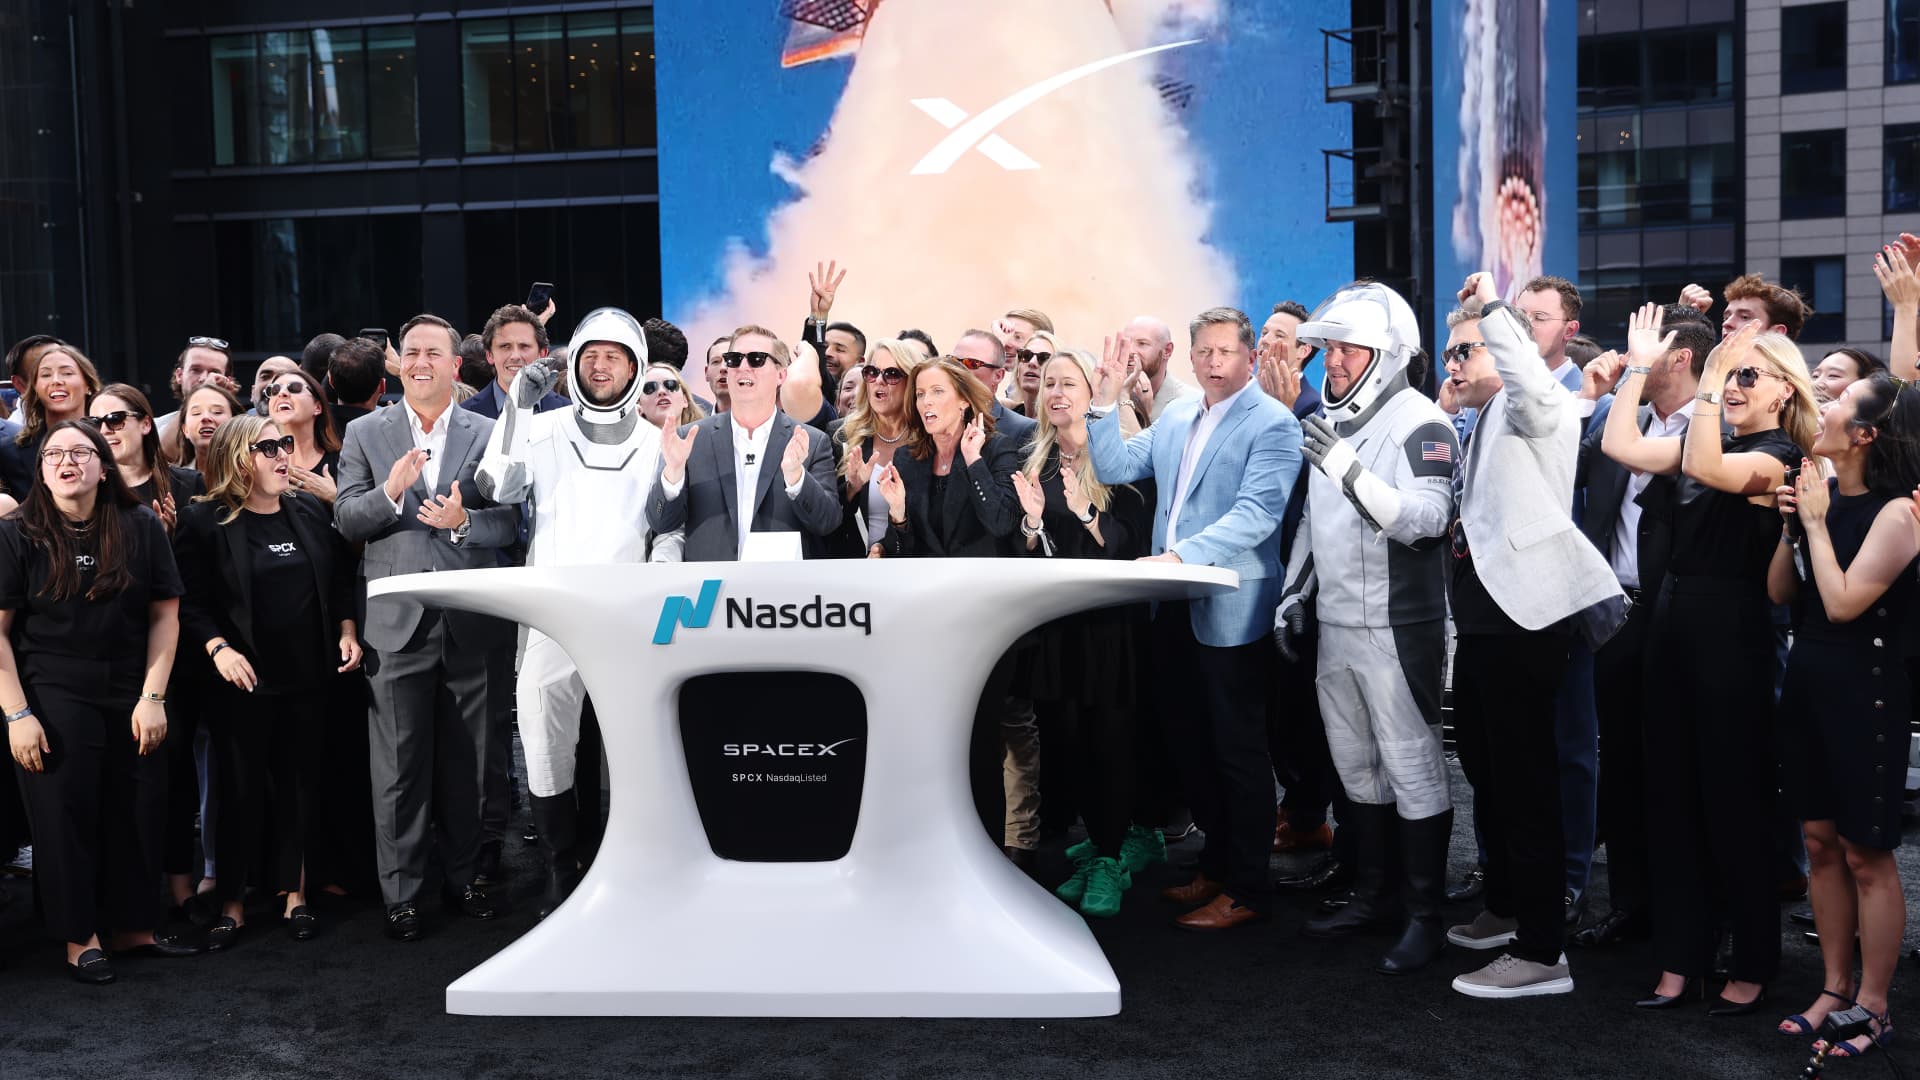
Market Update: SpaceX and Coca-Cola Reach New Highs

- SpaceX Joins Nasdaq: SpaceX was fast-tracked into the Nasdaq-100 on Tuesday, closing its first trading day at $160.95, approximately 30% below its June 16 high of $225.64, indicating strong market interest despite the decline.
- Financial Sector Surge: The S&P Financials sector surged 4.5% in the past week and 7.6% over the month, with 82 out of 85 stocks rising last week, led by Robinhood's impressive 43% increase over three months, reflecting renewed investor confidence in financial stocks.
- Coca-Cola Hits New High: Coca-Cola shares have risen 7.4% over the past three months, reaching a new high, while the S&P Staples sector remained flat, showcasing Coca-Cola's robust performance and stable consumer demand in a challenging market.
- Cybersecurity Stocks Reach All-Time Highs: CrowdStrike, Fortinet, and Palo Alto Networks all achieved record highs on Monday, with CrowdStrike up 100%, Fortinet up 97%, and Palo Alto Networks up 121% over three months, highlighting strong market interest and investment in cybersecurity solutions.
See More
Deposit Account Rates Decline, Lock in Competitive CD Returns
- Current CD Rates: Short-term CDs (6 to 12 months) currently offer rates around 4% APY, with the highest at 4.10% for a 14-month CD from Marcus by Goldman Sachs, indicating opportunities for competitive returns despite declining rates.
- Historical Rate Trends: Since 2009, CD rates have significantly decreased, particularly after the 2008 financial crisis when the average one-year CD rate fell to about 1%, reflecting the impact of economic slowdown and Federal Reserve rate cuts.
- Impact of Economic Policy: The COVID-19 pandemic in 2020 led to emergency rate cuts by the Fed, resulting in record low CD rates; however, subsequent inflation prompted the Fed to hike rates 11 times between 2022 and 2023, driving CD rates higher.
- Choosing the Best CD: When selecting a CD, it’s crucial to consider not only the APY but also the term length, type of financial institution, and account terms to align with personal financial goals and maximize returns.
See More
Vertex Acquires Crinetics for $10 Billion to Expand Rare Disease Portfolio
- Acquisition of Crinetics: Vertex Pharmaceuticals is acquiring Crinetics Pharmaceuticals for $10 billion, aiming to expand its business into endocrine diseases, with the potential to add up to $5 billion in annual revenue over the long term, although the market reacted negatively in the short term, pushing the stock down about 2%.
- Strategic Fit: Vertex CEO Reshma Kewalramani praised the acquisition as an excellent strategic fit, as Crinetics focuses on serious diseases in specialty markets with significant unmet needs, and it is expected to contribute revenue immediately through the ongoing launch of the Palsonify medicine.
- Revenue Growth Potential: The growing demand for therapeutics in endocrine diseases provides Vertex with a clear runway for double-digit revenue growth in the coming years, with Crinetics in the portfolio further solidifying its market position.
- Strong Market Performance: Since February 2022, Vertex's stock has outperformed the S&P 500 by 45%, demonstrating strong investor appeal, particularly in the current market environment.
See More
Meta's Plans to Compete in Cloud Computing Market Impact Neocloud Providers
- Stock Price Volatility: Following news of Meta's plans to enter the cloud computing market, CoreWeave's stock plummeted nearly 14% in a single day, while Nebius dropped 17%, reflecting market concerns about the future prospects of both companies, especially with Meta as a customer.
- Massive Contract Expansion: CoreWeave expanded its agreement with Meta in April 2023 to provide cloud computing capacity through 2032, valued at $21 billion, while Nebius announced in March it would provide $12 billion in cloud capacity, showcasing the strong collaborative potential in the AI data center sector.
- Sustained Demand Growth: Despite the competitive threat from Meta, demand for AI data centers from CoreWeave and Nebius remains robust, with CoreWeave noting that its 2026 capacity is largely sold out and 30% of its $99.4 billion revenue backlog comes from foundational AI labs, indicating urgent market demand for their services.
- Investment Opportunity Emerges: Although Meta's plans could impact CoreWeave and Nebius, the demand for AI data centers far exceeds supply, making the current stock price pullback a buying opportunity, particularly as CoreWeave's price-to-sales ratio is only 6.6, indicating potential investment value.
See More
Meta Enters AI Data Center Market, Impact on CoreWeave and Nebius
- Increased Competition: Meta's plan to enter the AI data center market led to a 14% and 17% drop in CoreWeave and Nebius shares respectively, indicating market concerns over new competition that could impact future revenue growth for both companies.
- Shifting Customer Dynamics: CoreWeave's agreement with Meta has been extended to 2032, valued at $21 billion, while Nebius has committed to providing $12 billion in cloud computing capacity, highlighting the importance of their business relationships despite increased competition.
- Strong Demand Continues: CoreWeave's AI cloud platform demand is nearing saturation for 2026, with 30% of its $99.4 billion revenue backlog coming from foundational AI labs, showcasing its robust market position and growth potential.
- Optimistic Industry Outlook: According to Goldman Sachs, U.S. data center power demand is projected to double to 66GW by 2027, indicating that the demand for AI data centers will continue to grow, positioning CoreWeave and Nebius to benefit from this trend.
See More
BlackRock: U.S. Stocks to Dominate AI Race
- Investment Preference: BlackRock Investment Institute maintains a neutral stance on Chinese stocks while staying overweight on U.S. equities, indicating a belief that U.S. companies will dominate the AI race, reflecting confidence in the U.S. market.
- Market Performance Comparison: While the Nasdaq Composite has gained over 12% this year, China's ChiNext index has surged more than 20%, indicating strong short-term performance of Chinese tech stocks; however, the overall MSCI China index has fallen over 10%, reflecting market uncertainty.
- Policy Support and Challenges: Beijing has rolled out policies to support domestic AI development amid U.S. restrictions on high-end technology, yet the unclear profitability of companies in the context of slower economic growth and fierce competition highlights market complexities.
- Investment Opportunities: BlackRock analysts see potential in physical AI, emphasizing the integration of AI technology into hardware, while recommending stocks exposed to scarce industry inputs, showcasing a focus on infrastructure investments.
See More
Market Update: SpaceX and Coca-Cola Reach New Highs
- SpaceX Joins Nasdaq: SpaceX was fast-tracked into the Nasdaq-100 on Tuesday, closing its first trading day at $160.95, approximately 30% below its June 16 high of $225.64, indicating strong market interest despite the decline.
- Financial Sector Surge: The S&P Financials sector surged 4.5% in the past week and 7.6% over the month, with 82 out of 85 stocks rising last week, led by Robinhood's impressive 43% increase over three months, reflecting renewed investor confidence in financial stocks.
- Coca-Cola Hits New High: Coca-Cola shares have risen 7.4% over the past three months, reaching a new high, while the S&P Staples sector remained flat, showcasing Coca-Cola's robust performance and stable consumer demand in a challenging market.
- Cybersecurity Stocks Reach All-Time Highs: CrowdStrike, Fortinet, and Palo Alto Networks all achieved record highs on Monday, with CrowdStrike up 100%, Fortinet up 97%, and Palo Alto Networks up 121% over three months, highlighting strong market interest and investment in cybersecurity solutions.
See More





