


Key Takeaways
- The Nasdaq Composite is a market index that tracks the performance of almost every company that is listed on the Nasdaq Stock Exchange.
- The S&P 500 index is an index fund that tracks the performance of 500 publicly traded leading companies in the United States.
- Nasdaq outperforms the S&P 500 in annual growth for tech-heavy weight, while the S&P 500 is less volatile due to diversification in various sectors, which include defensive stocks.
- The Nasdaq composite offers exposure to tech-heavy companies, innovations, and technology, which involves volatility and enables making higher returns, while the S&P 500 offers exposure to stable, balanced, diversified assets with long-term stability
Introduction
When it comes to investors seeking benchmarks to measure the United States stock market, the Nasdaq composite index and the S&P 500 index are prominent names. You may be wondering which one will suit you the most, as both represent a significant portion of the market; they differ in several factors, such as volatility, composite, and risk-reward ratio.
So, no wonder it is essential to understand both indices at a minimal level before making investment decisions in any or both of these prominent investment assets. This article covers both the Nasdaq and the S&P 500 index for a better understanding, besides listing key differences, performance comparison, pros and cons, etc. So, you can evaluate completely between these two and determine efficiently which one will suit your investment goals.
Introduction to Nasdaq and S&P 500
NASDAQ stands for National Association of Securities Dealers Automated Quotations. The Nasdaq Composite is a market index that tracks the performance of almost every company that is listed on the Nasdaq Stock Exchange. The number is more than 3000 companies, including giants like Microsoft, Facebook, Apple, Google, etc. The launching period of the platform is 1971, which provides transparent and faster execution of trades, besides providing an environment for utilizing advanced technological advantages in the financial market. The Nasdaq Composite has three tiers: the Nasdaq Global Select Market, the Nasdaq Global Market, and the Nasdaq Capital Market. NASDAQ has the prominent stock trade volume and is the most active trading, as it enables listing companies with minimal qualification requirements and fees, making it an appealing platform for companies.
The S&P 500 index is an index fund that tracks the performance of 500 publicly traded leading companies in the United States. These companies include various sectors, for instance, healthcare, technology, financials, etc. The index represents approximately. 80% of the total U.S. equity market value. So, no wonder it reflects the overall sentiment of the equity market. A committee selects the companies for the index, depending on several effective factors, such as liquidity and market capitalization. Individual traders can’t invest in the S&P 500 index directly, but there are many ETFs and mutual funds that track the composition and performance of the index.
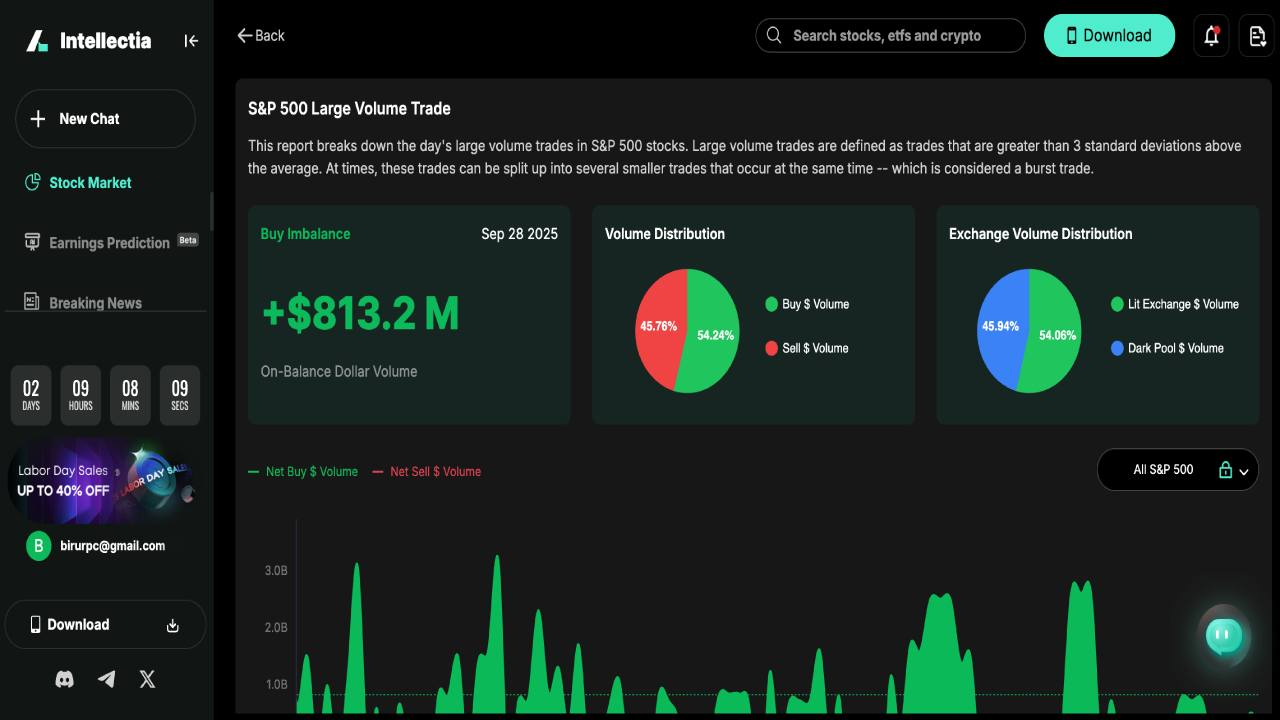
Investors can see the insight of the stock market from the intellectia.ai stock market tool, that includes market sentiment, sector performance, trading volume and trading signal.
Key Differences Between Nasdaq and S&P 500
Performance Comparison
Let’s check the comparison of Nasdaq vs S&P 500 performance at a glance:
Nasdaq Composite | Standard and Poor’s 500 index |
Typically represents companies that traded on the Nasdaq exchange | Stocks listed on the S&P 500 index usually represent the prominent U.S. stocks based on market capitalization. |
The Nasdaq composite focuses on the top 100 companies that trade on the exchange, mostly tech giants, besides other sectors like healthcare, industrials, and consumer discretionary. | The S&P 500 index involves companies that are prominent in the United States based on market capitalization from various sectors such as financials, information technology, health care, communication services, consumer discretionary, and industrials. The rest have five other categories. |
Investors often use Nasdaq as a proxy for the technology sector, although it involves companies from various other sectors. Investing in funds that track the performance of the Nasdaq Composite is often regarded as a growth strategy rather than a value strategy. | The S&P 500 is similar to the Dow Jones, where the Dow Jones represents 30 (blue chip) companies, but the S&P 500 index represents 500 prominent companies from various sectors. |
The Nasdaq composite is more volatile than the S&P 500 index due to its tech-heavy weight. A higher beta means considerable swings during bullish and bearish market conditions. | The S&P 500 index is less volatile than the Nasdaq composite due to diversification and defensive stocks like utilities and healthcare. |
Index | 1-Year Performance(%) | 5-Year Performance (%) | 10-Year Performance (%) | All-Time Performance (%) |
Nasdaq Composite | 33.14 | 122.93 | 299.32 | 18,489 |
S&P 500 | 31.16 | 91.93 | 188.47 | 132,606 |
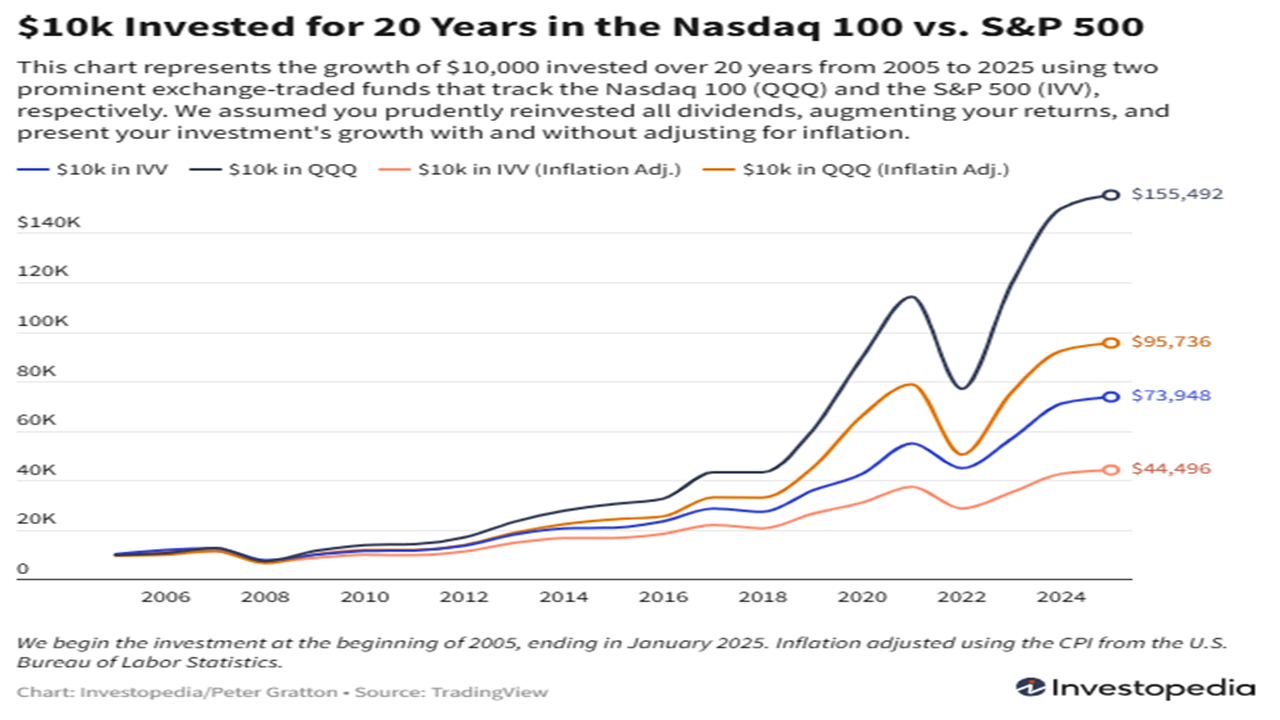
The chart above shows the performance or approximate return from a $10k investment in the Nasdaq composite and the S&P 500 for 20 years.
Insights
- Nasdaq outperforms the S&P 500 in annual growth for tech-heavy weight, while the S&P 500 is less volatile due to diversification in various sectors, which include defensive stocks. For instance, during the tech boom in 2010, Nasdaq provided double-digit returns.
- The S&P 500 index shows slower growth but shows impressive resilience during downturns, for example, during the 2008 crisis or the tech-driven correction in 2022.
- Over the longer period, the S&P 500 index fund is attractive for retirement-focused and conservative investors.
Pros and Cons of Investing in Each Index
This part lists the strengths and weaknesses of the Nasdaq or S&P 500 for investing.
Pros and cons of the Nasdaq composite:
Pros
- The Nasdaq composite provides exposure to some of the most valuable and fast-rising companies of the world, such as Google, Facebook (META), NVIDIA, TESLA, etc.
- It offers exposure to companies that are reshaping Artificial Intelligence, innovation, technology, Semiconductor, biotech, and electric vehicles.
- Historically, Nasdaq provided a higher CAGR during growth cycles in comparison to other indices.
- Tracks the performances of more than 3000 companies, which are large-cap, mid-cap, and small-cap.
Cons
- Concentration in tech and growth stocks makes it more vulnerable during market turmoil, especially during sector downturns, interest rate decisions, and market corrections.
- It often suffers a significant decline in a bear market environment (for example, the 2008 financial crisis, the 2022 tech sell-off)
- Nasdaq has limited access to defensive stocks compared to the S&P 500 index, sectors such as utilities, healthcare, etc.
- The risk profile might not be suitable for investors seeking retirement investment and lower volatility.
Pros and cons of the S&P 500 index:
Pros
- S&P 500 enables broader market exposure and a lower expense ratio.
- It has historical and long-term outperformance and enables passive management stability.
- It enables dividend income potential and tax efficiency of index funds and ETFs.
- Enables easy dollar cost averaging, transparency, and liquidity.
- S&P 500 enables exposure to the top U.S. companies and offers an inflation hedge via equity growth.
Cons
- The S&P 500 has limited exposure to small-cap and mid-cap companies, so it has market cap concentration risks.
- Dividend yield is lower than high-income investment methods.
- Slower growth potential compared to the Nasdaq during tech bubbles.
- The S&P 500 has no risk-hedging or downside mechanism.
Which Index Should You Choose?
When it comes to choosing between the Nasdaq and S&P 500 index, it significantly depends on several unavoidable factors of the investor, such as risk tolerance, investment goal, time horizon, etc.
- For growth-focused investors who are willing to deal with high volatility and expect higher returns, Nasdaq might be the appropriate choice. ETFs such as Invesco QQQ (QQQ) are popular assets that mirror the performance of the Nasdaq 100.
- For stability-oriented investors who seek assets with lower risks, slower but consistent returns S&P 500 index is preferable for them. In that case, SPDR S&P 500 ETF Trust (SPY) or Vanguard S&P 500 (VOO) are very popular options among investors.
- Meanwhile, there are many investors who invest in both the Nasdaq and the S&P 500 index; they use the S&P 500 as a foundation of stability and the Nasdaq for growth potential.
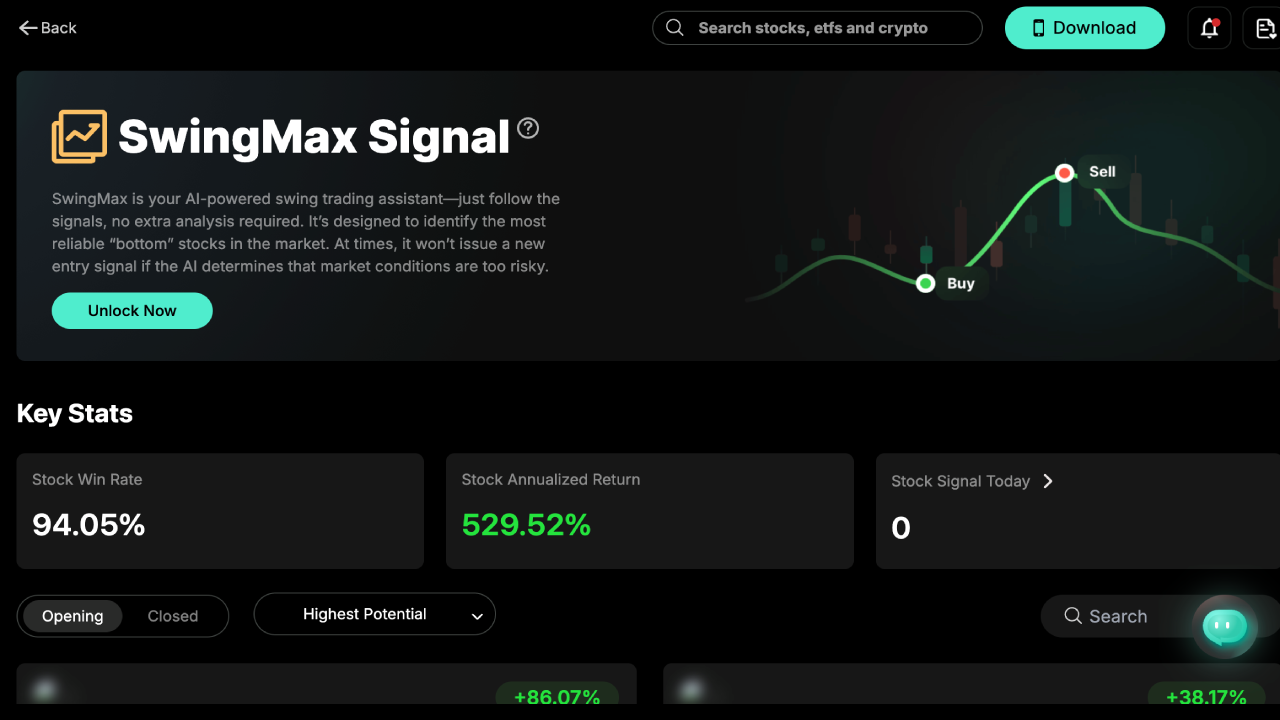
Platforms like intellectia.ai offer AI tools and data-driven approaches to compare QQQ and VOO, which help investors make more informed investment decisions. The platform offers an AI-driven trading signal known as SwingMax Signal, which helps investors align with their investment goals.
Nasdaq vs. S&P 500: Choosing the Right Index for You
The Nasdaq composite offers exposure to tech-heavy companies, innovations, and technology, which involves volatility and enables making higher returns, while the S&P 500 offers exposure to stable, balanced, diversified assets with long-term stability. Historically, the S&P 500 delivered approximately 10.4% annualized returns, while the Nasdaq provided more growth during the same period with more risk tolerance. So, the choice is up to you, based on your risk tolerance and investment period.
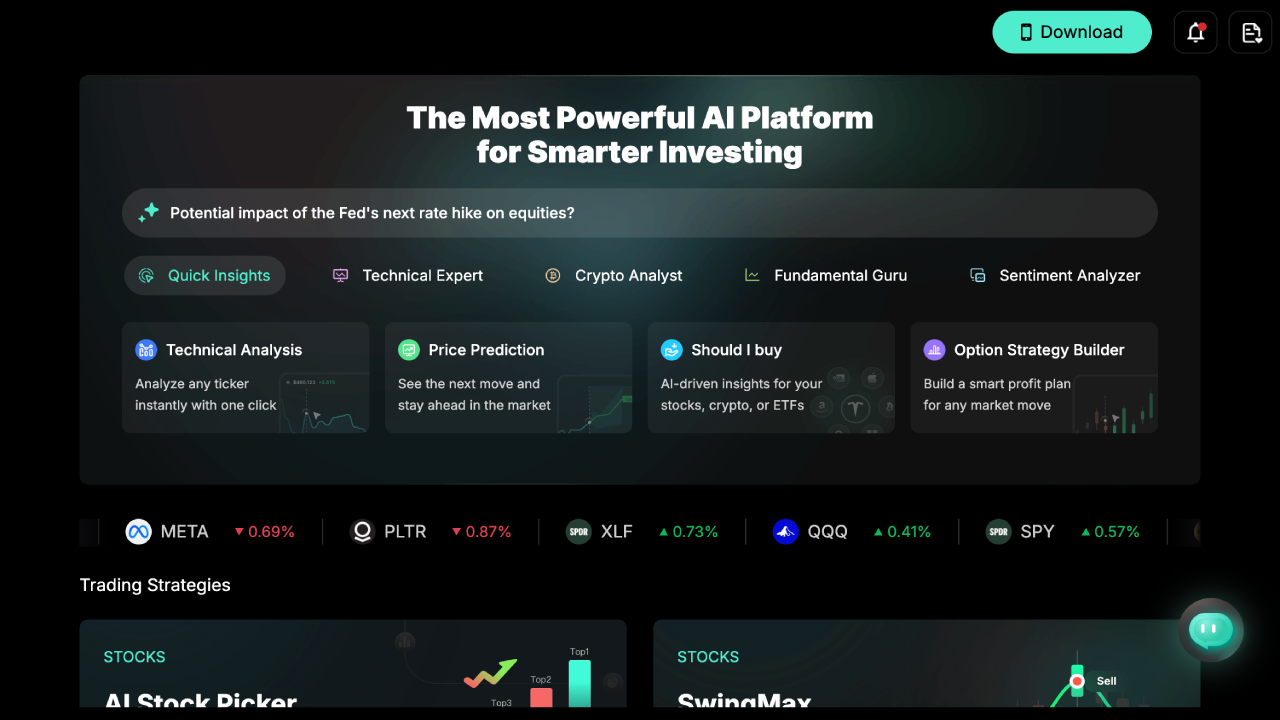
You can utilize analytical tools from intellectia.ai AI Agent with your trading idea, thoughts and discuss your opinion on Nasdaq 100 vs S&P 500 stocks.
Conclusion
Now, you have a complete understanding of the Differences between Nasdaq and S&P 500. Both have strengths and weaknesses, and it’s up to you to select which one will suit your investment goal. You can choose any of these or a bot, like many other investors around the globe. Nasdaq presents an opportunity to make considerable profit through concentration on the technology sector, while the S&P 500 provides diversified, more stable, and long-term growth potential involving less risk.
A data-driven approach is a key element for success in this complex financial market. For daily stock picks, in-depth market analysis, trading signals, and much more, sign up for intellectia.ai today and enjoy the best experience. The data-driven approach will help you to find the best index for long-term investment.