

PAGE NOT FOUND
Oops! It seems the page you are looking for does not exist...
Back to HomepageBlog
Get What You Are Looking For Here
Crypto Analysis
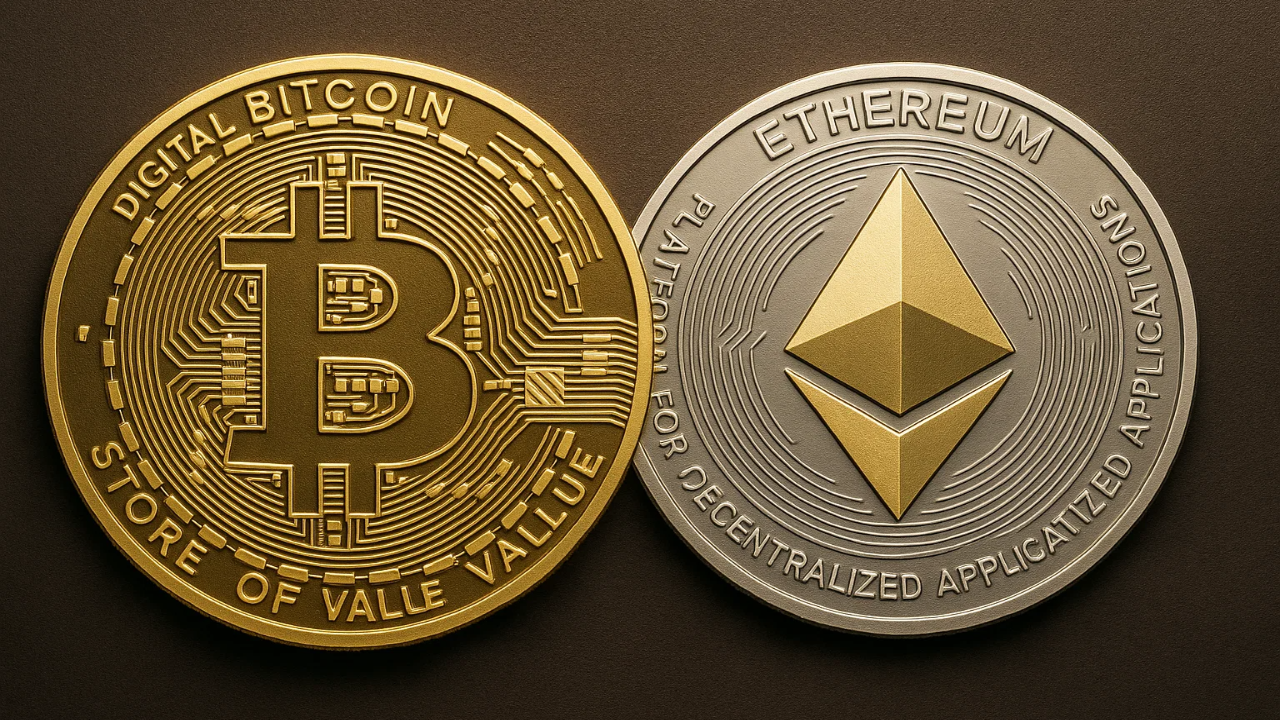
Bitcoin vs Ethereum: Unpacking the Ultimate Crypto Showdown for Your Investments
Jason1 days ago
Financial Analysis
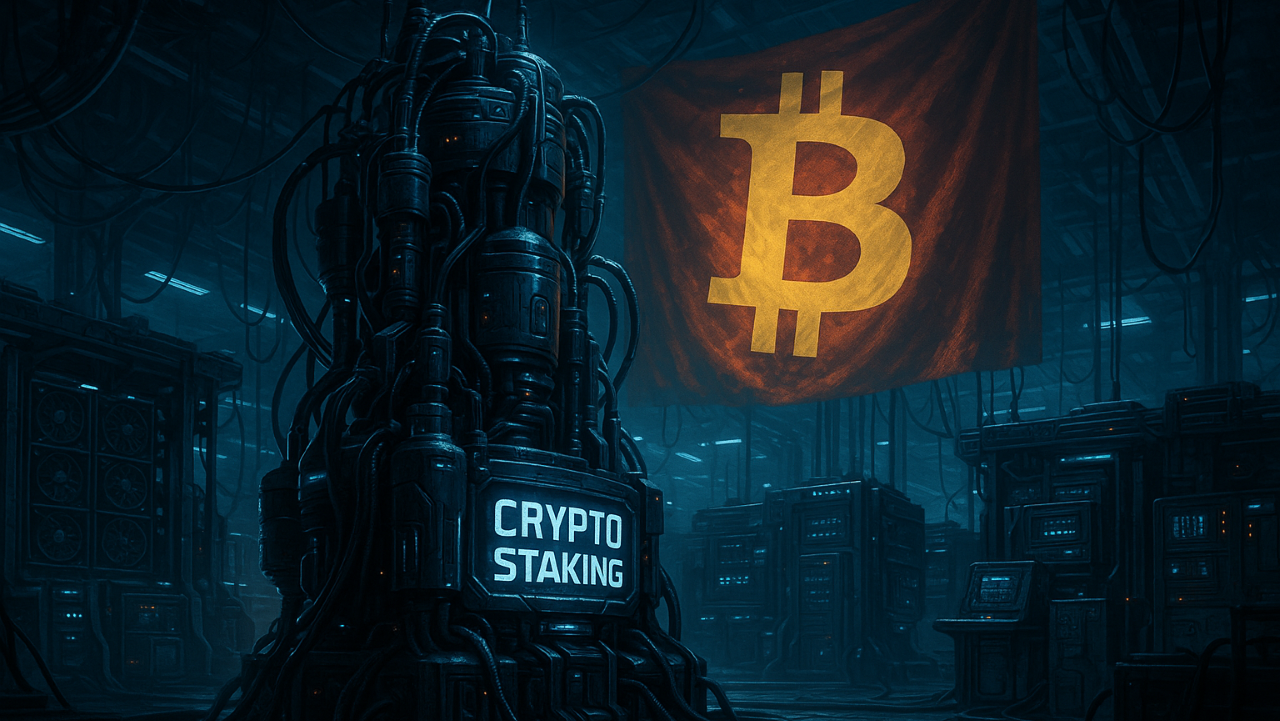
Crypto Staking Explained: Your Guide to Earning Passive Income
Jason3 days ago

Educational Resources
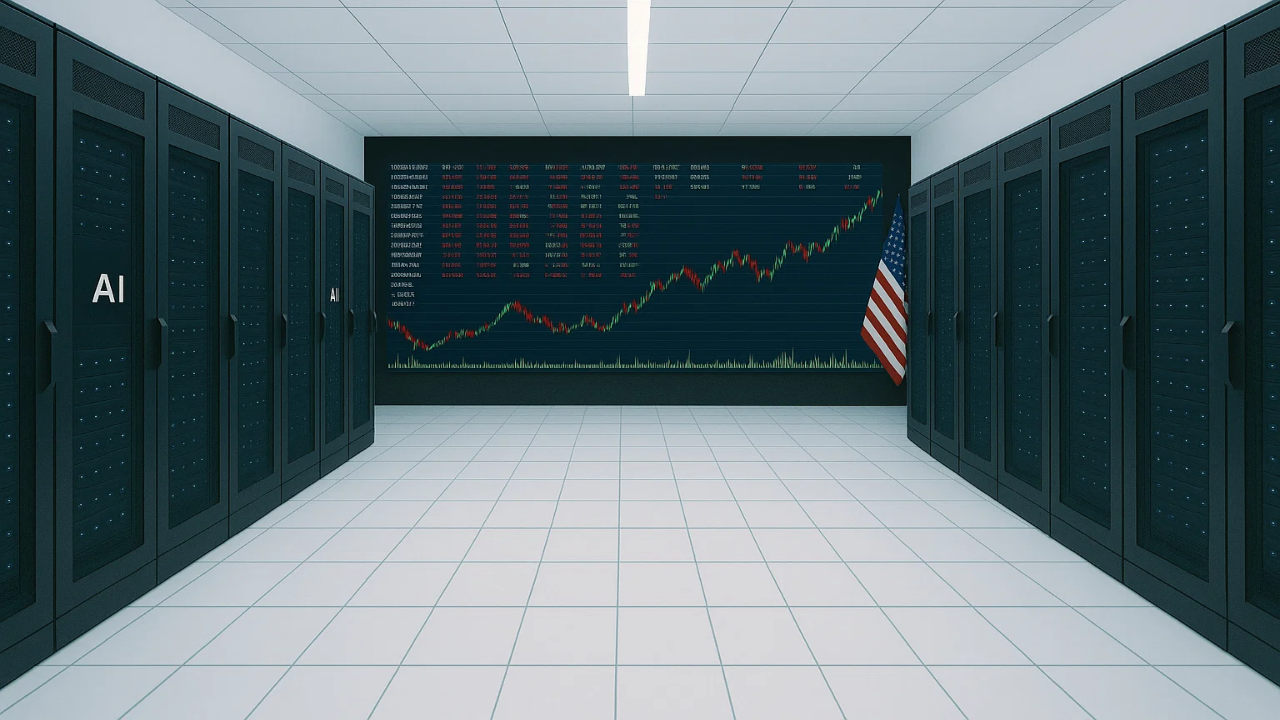
AI Trading vs Human Trading: Which Should You Trust?
Jason5 days ago
Educational Resources
Unlocking the Power of AI in Investing: Benefits and Strategies
Jason Huang7 days ago