stocks logo

SERV

Serve Robotics Inc
$
11.350
-0.3(-2.575%)1D
  • Overview
  • Forecast
  • Valuation
  • Earnings
Line
Line
|
Candle
Candle
1D
5D
1M
3M
6M
YTD
1Y
5Y
High
12.110
Open
11.870
VWAP
--
Vol
4.14M
Mkt Cap
648.35M
Low
11.300
Amount
--
EV/EBITDA(TTM)
--
Total Shares
57.12M
EV
467.73M
EV/OCF(TTM)
--
P/S(TTM)
395.84
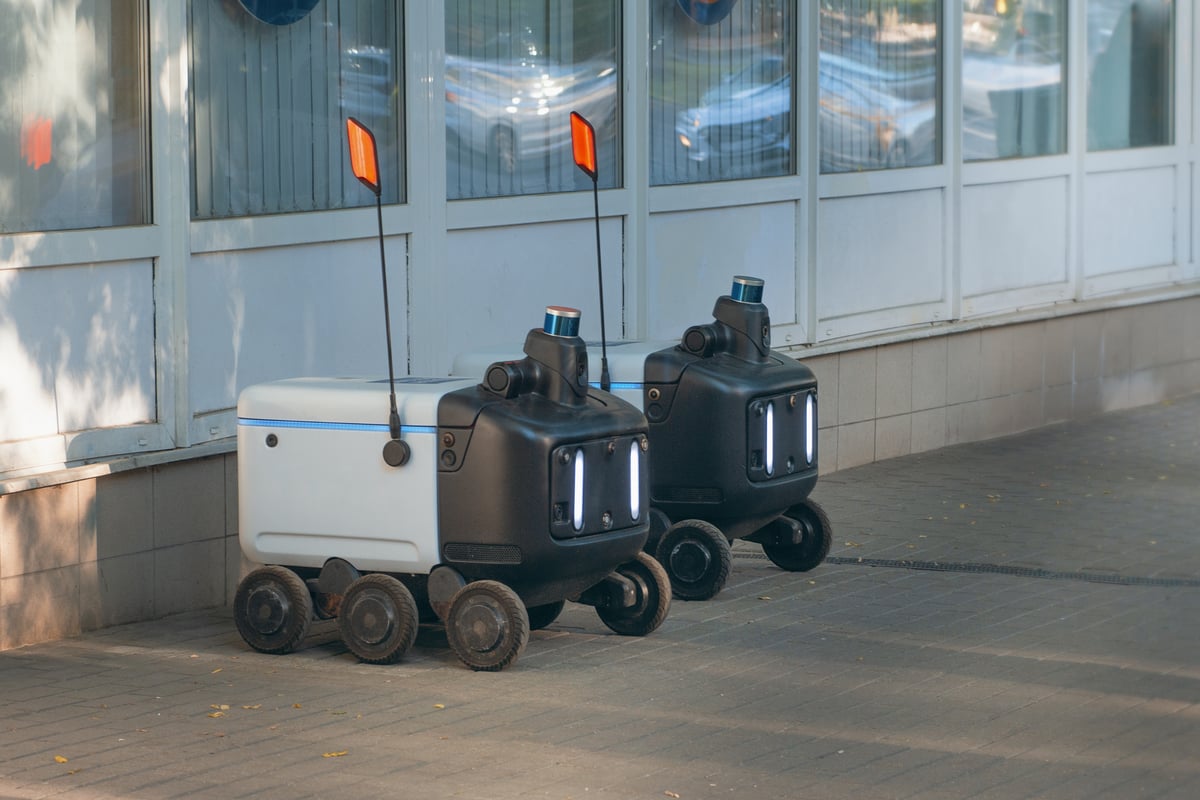
Serve Robotics, Inc. is engaged in developing next generation robots for last-mile delivery services. The Company designs, develops and operates low-emission robots on its artificial intelligence (AI)-powered robotics mobility platform that serves people in public spaces, starting with food delivery. The Company’s fleet consists of over 100 robots. It has platform-level integrations with Uber Eats, which allows serve robots to provide real-time presence and status updates on those platforms and receive requests to perform deliveries with respect to customer orders placed on those platforms as needed. Its capabilities include automatic emergency braking, vehicle collision avoidance, and fail-safe mechanical braking. It uses AI methodologies to design, train and deploy a host of models on serve robots and these models are used to perform a variety of tasks, including identification of sidewalk surfaces, intersections, traffic signals, obstacles, pedestrians and vehicles, and others.
Show More

Market Estimates

Earnings Estimates
Revenue
YoY Chg
EPS
YoYChg
FY2025Q2
FY2025Q3
624.85K
+33.41%
--
--
1.82M
+721.63%
--
--
Estimates Revision
The market is revising Downward the revenue expectations for Serve Robotics Inc. (SERV) for FY2025, with the revenue forecasts being adjusted by -30.34% over the past three months. During the same period, the stock price has changed by 75.97%.
Revenue Estimates for FY2025
Revise Downward
down Image
-30.34%
In Past 3 Month
Stock Price
Go Up
up Image
+75.97%
In Past 3 Month
2 Analyst Rating
up Image
76.21% Upside
Wall Street analysts forecast SERV stock price to rise over the next 12 months. According to Wall Street analysts, the average 1-year price target for SERV is 20.00 USD with a low forecast of 17.00 USD and a high forecast of 23.00  USD. However, analyst price targets are subjective and often lag stock prices, so investors should focus on the objective reasons behind analyst rating changes, which better reflect the company's fundamentals.
2 Buy
0 Hold
0 Sell
Moderate Buy
up Image
76.21% Upside
Current: 11.350
sliders
Low
17.00
Averages
20.00
High
23.00
Cantor Fitzgerald
Andres Sheppard
Overweight
initiated
$17
2025-05-23
Reason
Cantor Fitzgerald
initiated
$17
2025-05-22
Reason
Cantor Fitzgerald initiated coverage of Serve Robotics with an Overweight rating and $17 price target.
Northland Capital Markets
Michael Latimore
Buy
Maintains
$16 → $23
2025-01-15
Reason
Serve Robotics has entered into securities purchase agreements with certain institutional investors for the purchase and sale of 4,210,525 shares of common stock, pursuant to a registered direct offering, expected to result in gross proceeds of approximately $80M, before deducting placement agent fees and other offering expenses. The offering is expected to close on or about January 7, 2025, subject to the satisfaction of customary closing conditions. The Company intends to use net proceeds from the offering for general corporate purposes, including working capital. Northland Capital Markets is acting as the exclusive placement agent for the transaction.
Ladenburg Thalmann
Glenn Mattson
Strong Buy
Initiates
$16
2024-10-28
Reason
Ladenburg initiated coverage of Serve Robotics with a Buy rating and $16 price target.
Northland Capital Markets
Michael Latimore
Buy
Initiates
$16
2024-10-18
Reason
Seaport Global
Aaron Kessler
Strong Buy
Initiates
$12
2024-10-07
Reason

Valuation Metrics

The current forward P/E ratio for Serve Robotics Inc (SERV.O) is -13.27, compared to its 5-year average forward P/E of -11.07. For a more detailed relative valuation and DCF analysis to assess Serve Robotics Inc 's fair value, click here.

Forward PE

StronglyUndervaluedUndervaluedFairOvervaluedStronglyOvervalueddotted line Image
N/A
5Y Average PE
-11.07
Current PE
-13.27
Overvalued PE
-4.60
Undervalued PE
-17.54

Forward EV/EBITDA

StronglyUndervaluedUndervaluedFairOvervaluedStronglyOvervalueddotted line Image
N/A
5Y Average EV/EBITDA
-13.48
Current EV/EBITDA
-12.75
Overvalued EV/EBITDA
-4.70
Undervalued EV/EBITDA
-22.26

Forward PS

StronglyUndervaluedUndervaluedFairOvervaluedStronglyOvervalueddotted line Image
Fair
5Y Average PS
62.47
Current PS
45.30
Overvalued PS
102.79
Undervalued PS
22.16

Financials

Annual
Quarterly
FY2025Q1
YoY :
-53.47%
440.47K
Total Revenue
FY2025Q1
YoY :
+94.58%
-15.00M
Operating Profit
FY2025Q1
YoY :
+46.23%
-13.22M
Net Income after Tax
FY2025Q1
YoY :
-4.17%
-0.23
EPS - Diluted
FY2025Q1
YoY :
+216.62%
-12.92M
Free Cash Flow
FY2025Q1
YoY :
-631.07%
-333.35
Gross Profit Margin - %
FY2025Q1
YoY :
+112.04%
-3.11K
FCF Margin - %
FY2025Q1
YoY :
+214.30%
-3.00K
Net Margin - %

Trading Trends

Insider
Insiders are Neutral. There are no significant trading trends over the last month.
Sold
0-3
Months
572.3K
USD
12
3-6
Months
35.8K
USD
6
6-9
Months
6.5M
USD
43
0-12
Months
125.1K
USD
1
Bought
0-3
0
0.0
USD
Months
3-6
1
20.6K
USD
Months
6-9
0
0.0
USD
Months
0-12
0
0.0
USD
Months
Hedge Fund
Hedge Funds are Neutral. There are no significant trading trends over the last quarter.
Sold
0-3
Months
0.0
Volume
0
3-6
Months
0.0
Volume
0
6-9
Months
0.0
Volume
0
0-12
Months
0.0
Volume
0
Bought
0-3
0
0.0
Volume
Months
3-6
0
0.0
Volume
Months
6-9
0
0.0
Volume
Months
0-12
0
0.0
Volume
Months
Congress Trading
Congress are Neutral. There are no significant trading trends over the last month.
Sold
0-3
Months
0.0
USD
0
3-6
Months
0.0
USD
0
6-9
Months
0.0
USD
0
0-12
Months
0.0
USD
0
Bought
0-3
0
0.0
USD
Months
3-6
0
0.0
USD
Months
6-9
0
0.0
USD
Months
0-12
0
0.0
USD
Months

SERV News & Events

Events Timeline

2025-06-26 (ET)
2025-06-26
07:09:13
Serve Robotics brings autonomous robot delivery to Atlanta
select
2025-05-08 (ET)
2025-05-08
16:11:24
Serve Robotics sees Q2 revenue $600,000-$700,000, consensus $787,310
select
2025-05-08
16:10:34
Serve Robotics reports Q1 EPS (23c), consensus (15c)
select
Sign Up For More Events

News

3.5
07-25WSJ
The Robots and Drones Making Food Delivery Better, Faster and Cheaper
3.0
07-25NASDAQ.COM
2 Top Robotics Stocks to Buy Right Now
6.5
07-23NASDAQ.COM
Prediction: 1 Growth Stock That Will Be Worth More Than Newsmax 1 Year From Now
Sign Up For More News

FAQ

arrow icon

What is Serve Robotics Inc (SERV) stock price today?

The current price of SERV is 11.35 USD — it has decreased -2.58 % in the last trading day.

arrow icon

What is Serve Robotics Inc (SERV)'s business?

arrow icon

What is the price predicton of SERV Stock?

arrow icon

What is Serve Robotics Inc (SERV)'s revenue for the last quarter?

arrow icon

What is Serve Robotics Inc (SERV)'s earnings per share (EPS) for the last quarter?

arrow icon

What changes have occurred in the market's expectations for Serve Robotics Inc (SERV)'s fundamentals?

arrow icon

How many employees does Serve Robotics Inc (SERV). have?

arrow icon

What is Serve Robotics Inc (SERV) market cap?