HAIN Overview
-
$
0.000
0.000(0.000%)
At close0.000(0.000%)Aft-market
ET
Loading chart...

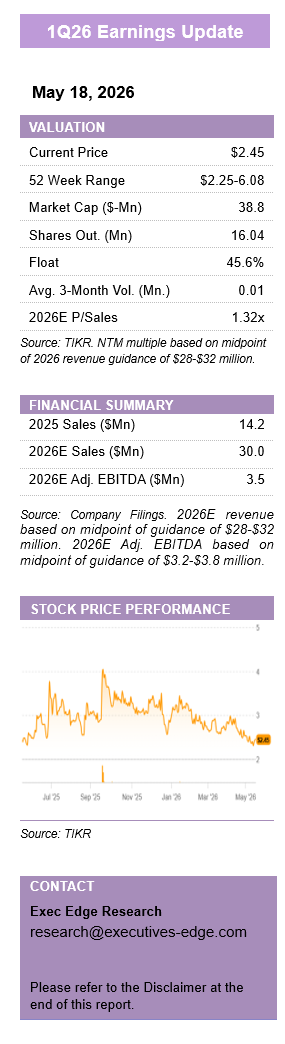
The current price of HAIN is 0.5946 USD — it has increased 4.57
The Hain Celestial Group, Inc. is a health and wellness company. The Company is focused on delivering nutrition and well-being. Its segments include North America and International. The North America segment includes United States and Canada. The International segment includes United Kingdom and Western Europe. The Company’s products across beverages, yogurt, baby/kids and meal preparation are marketed and sold in over 70 countries around the world. Its brands include Celestial Seasonings teas, The Greek Gods yogurt, Earth's Best Organic and Ella's Kitchen baby and kid's foods, Joya and Natumi plant-based beverages, Hartley’s jelly, as well as Cully & Sully, Yorkshire Provender, and New Covent Garden soups, among others. Its personal care products include JASON, Avalon Organics, Alba Botanica, and Live Clean. Its meal prep brands include Gale's, Farmhouse Fare, Rose's, Linda McCartney's, Frank Cooper's, Spectrum, MaraNatha, Imagine, The Greek Gods, and Cully & Sully.
Wall Street analysts forecast HAIN stock price to rise over the next 12 months. According to Wall Street analysts, the average 1-year price target for HAIN is3.25 USD with a low forecast of 1.50 USD and a high forecast of 5.00 USD. However, analyst price targets are subjective and often lag stock prices, so investors should focus on the objective reasons behind analyst rating changes, which better reflect the company's fundamentals.
Hain Celestial Group Inc revenue for the last quarter amounts to 338.36M USD, decreased -13.32
Hain Celestial Group Inc. EPS for the last quarter amounts to -1.17 USD, decreased -21.48
Hain Celestial Group Inc (HAIN) has 2600 emplpoyees as of July 08 2026.
Today HAIN has the market capitalization of 53.66M USD.