stocks logo

FURY

Fury Gold Mines Ltd
$
0.503
-0.003(-0.592%)1D
  • Overview
  • Forecast
  • Valuation
  • Earnings
Line
Line
|
Candle
Candle
1D
5D
1M
3M
6M
YTD
1Y
5Y
High
0.512752
Open
0.510
VWAP
0.51
Vol
298.27K
Mkt Cap
86.34M
Low
0.500
Amount
152.27K
EV/EBITDA(TTM)
--
Total Shares
152.20M
EV
113.38M
EV/OCF(TTM)
--
P/S(TTM)
--
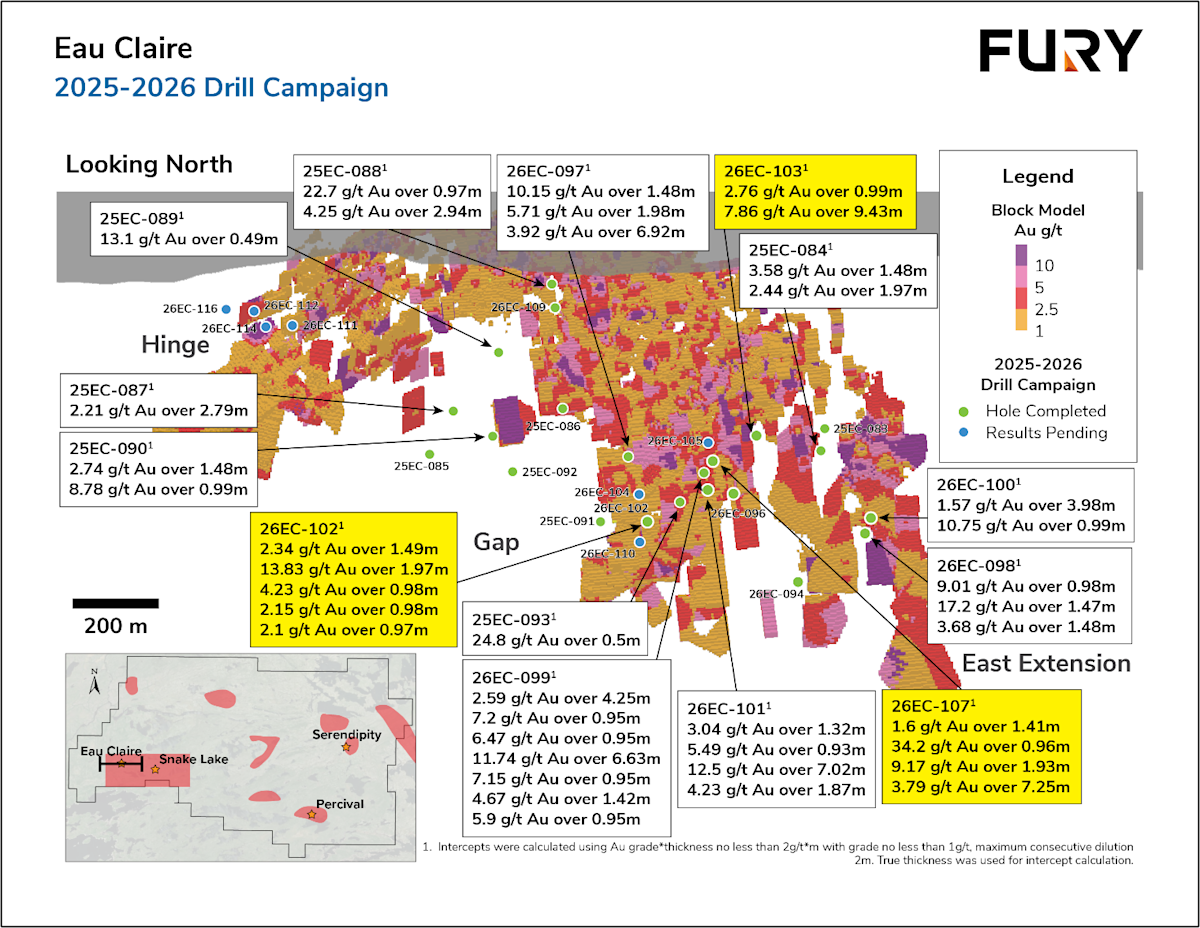
Fury Gold Mines Limited is a Canadian-focused exploration company. The Company consolidates a prospective gold and critical minerals exploration portfolio totaling over 157,000 hectares in Quebec. It has a portfolio of mineral properties, including the Eau Claire property located in the Eeyou Istchee James Bay Region of Northern Quebec (the Eau Claire Project), the Committee Bay gold project located in the Kitikmeot Region of Nunavut (the Committee Bay Project) and the Eleonore South property also located in the Eeyou Istchee James Bay Region of Northern Quebec (Eleonore South Project). Its other assets include the Sakami project, the Elmer East project, and the Kipawa project, among others. The Sakami gold project is located in Eeyou Istchee James Bay territory in Quebec, Canada. The Elmer East gold and lithium project is located in Eeyou Istchee James Bay territory in Quebec, Canada. The Kipawa project is located about 50 kilometers east of Temiscaming in southwestern Quebec.
Show More

Market Estimates

Earnings Estimates
Revenue
YoY Chg
EPS
YoYChg
FY2022Q3
--
--
0.000
-100%
Estimates Revision
Stock Price
Go Up
up Image
+37.06%
In Past 3 Month
2 Analyst Rating
up Image
178.33% Upside
Wall Street analysts forecast FURY stock price to rise over the next 12 months. According to Wall Street analysts, the average 1-year price target for FURY is 1.40 USD with a low forecast of 1.40 USD and a high forecast of 1.40  USD. However, analyst price targets are subjective and often lag stock prices, so investors should focus on the objective reasons behind analyst rating changes, which better reflect the company's fundamentals.
2 Buy
0 Hold
0 Sell
Moderate Buy
up Image
178.33% Upside
Current: 0.503
sliders
Low
1.40
Averages
1.40
High
1.40
H.C. Wainwright
Buy
maintain
2025-07-15
Reason
H.C. Wainwright raised the firm's price target on Fury Gold Mines to $1.40 from $1.20 and keeps a Buy rating on the shares after the company announced the commencement of its 2025 exploration drilling program at the Committee Bay project.
HC Wainwright & Co.
Heiko Ihle
Strong Buy
Maintains
$1.1 → $1.2
2025-04-21
Reason
HC Wainwright & Co.
Heiko Ihle
Strong Buy
Maintains
$2 → $1.1
2025-01-14
Reason
HC Wainwright & Co.
Heiko Ihle
Strong Buy
Maintains
$1.9 → $2
2024-10-25
Reason
HC Wainwright & Co.
Heiko Ihle
Strong Buy
Maintains
$1.8 → $1.9
2024-08-29
Reason

Valuation Metrics

The current forward P/E ratio for Fury Gold Mines Ltd (FURY.A) is 0.00, compared to its 5-year average forward P/E of -1.19. For a more detailed relative valuation and DCF analysis to assess Fury Gold Mines Ltd 's fair value, click here.

Forward PE

StronglyUndervaluedUndervaluedFairOvervaluedStronglyOvervalueddotted line Image
N/A
5Y Average PE
-1.19
Current PE
0.00
Overvalued PE
19.70
Undervalued PE
-22.08

Forward EV/EBITDA

StronglyUndervaluedUndervaluedFairOvervaluedStronglyOvervalueddotted line Image
N/A
5Y Average EV/EBITDA
-7.29
Current EV/EBITDA
-18.12
Overvalued EV/EBITDA
-2.45
Undervalued EV/EBITDA
-12.14

Forward PS

StronglyUndervaluedUndervaluedFairOvervaluedStronglyOvervalueddotted line Image
N/A
5Y Average PS
0.00
Current PS
0.00
Overvalued PS
0.00
Undervalued PS
0.00

Financials

Annual
Quarterly
FY2025Q1
YoY :
+81.89%
-3.37M
Operating Profit
FY2025Q1
YoY :
+318.91%
-2.99M
Net Income after Tax
FY2025Q1
-0.02
EPS - Diluted
FY2025Q1
YoY :
-40.76%
-2.55M
Free Cash Flow
FY2025Q1
N/A
ROIC

Trading Trends

Insider
Insiders are Neutral. There are no significant trading trends over the last month.
Sold
0-3
Months
0.0
USD
0
3-6
Months
0.0
USD
0
6-9
Months
0.0
USD
0
0-12
Months
0.0
USD
0
Bought
0-3
0
0.0
USD
Months
3-6
0
0.0
USD
Months
6-9
0
0.0
USD
Months
0-12
0
0.0
USD
Months
Hedge Fund
Hedge Funds are Neutral. There are no significant trading trends over the last quarter.
Sold
0-3
Months
0.0
Volume
0
3-6
Months
0.0
Volume
0
6-9
Months
0.0
Volume
0
0-12
Months
0.0
Volume
0
Bought
0-3
0
0.0
Volume
Months
3-6
0
0.0
Volume
Months
6-9
0
0.0
Volume
Months
0-12
0
0.0
Volume
Months
Congress Trading
Congress are Neutral. There are no significant trading trends over the last month.
Sold
0-3
Months
0.0
USD
0
3-6
Months
0.0
USD
0
6-9
Months
0.0
USD
0
0-12
Months
0.0
USD
0
Bought
0-3
0
0.0
USD
Months
3-6
0
0.0
USD
Months
6-9
0
0.0
USD
Months
0-12
0
0.0
USD
Months

FURY News & Events

Events Timeline

2025-07-22 (ET)
2025-07-22
07:14:09
Fury Gold Mines announces preliminary test results on Ninaaskumuwin lithium
select
2025-07-14 (ET)
2025-07-14
07:05:07
Fury Gold Mines commences 2025 drill program at Committee Bay project
select
2025-07-09 (ET)
2025-07-09
07:08:23
Fury Gold Mines announces drill results from Elmer East project
select
Sign Up For More Events

News

4.0
07-15Benzinga
HC Wainwright & Co. Maintains Buy on Fury Gold Mines, Raises Price Target to $1.4
1.0
06-27Newsfilter
Fury Announces Results of Annual General Meeting of Shareholders
3.5
06-16Newsfilter
Fury Finalizes Drill Targeting at its Newly Acquired Sakami Gold Project
Sign Up For More News

FAQ

arrow icon

What is Fury Gold Mines Ltd (FURY) stock price today?

The current price of FURY is 0.503 USD — it has decreased -0.59 % in the last trading day.

arrow icon

What is Fury Gold Mines Ltd (FURY)'s business?

arrow icon

What is the price predicton of FURY Stock?

arrow icon

What is Fury Gold Mines Ltd (FURY)'s revenue for the last quarter?

arrow icon

What is Fury Gold Mines Ltd (FURY)'s earnings per share (EPS) for the last quarter?

arrow icon

What changes have occurred in the market's expectations for Fury Gold Mines Ltd (FURY)'s fundamentals?

arrow icon

How many employees does Fury Gold Mines Ltd (FURY). have?

arrow icon

What is Fury Gold Mines Ltd (FURY) market cap?