Intellectia LogoIntellectia
Product
Resources
Markets
Pricing
Sign inTry for Free
Intellectia Logo
Sign in
Intellectia Logo

Product

Features
Financial AI Agent
Stock Technical Analysis
Stock Monitor
Hedge Fund Tracker
Crypto Technical Analysis
AI Screener
Trading Strategies
AI Stock Picker
Swing Trading
Earnings Trading
Stock Chart Patterns
Daytrading Center

Resources

Learn
Blog
Earnings
Tutorial
Help Center
Company
About Us
Contact
Press
Reward Program
Partner Program
Dividend Calculator
Dividend Yield Calculator
Options Profit Calculator
Compare
TradingView
SeekingAlpha

Markets

Trending Stocks
Hot Crypto
Trending News
All Stocks
Pricing
Start for Free
  1. Home
  2. >
  3. Stock
  4. >
  5. ESLT
stocks logo

ESLT

-
Add to WatchlistAdvanced Chart
$
0.000
0.000(0.000%)
High
--
Open
--
VWAP
--
Vol
--
Mkt Cap
--
Low
--
Amount
--
EV/EBITDA(TTM)
--
Total Shares
--
EV
--
EV/OCF(TTM)
--
P/S(TTM)
--

Market Estimates

Earnings Estimates
Earnings Estimates
Revenue
YoY Chg
EPS
YoYChg
FY2025Q1
FY2025Q2
FY2025Q3
1.69B
+8.63%
--
--
1.89B
+16.16%
--
--
1.96B
+14.29%
--
--
Estimates Revision
The market is revising Upward the revenue expectations for Elbit Systems Ltd. (ESLT) for FY2025, with the revenue forecasts being adjusted by 4.48% over the past three months. During the same period, the stock price has changed by 19.66%.
Revenue Estimates for FY2025
Revise Upward
up Image
+4.48%
In Past 3 Month
Stock Price
Go Up
up Image
+19.66%
In Past 3 Month
2 Analyst Rating
down Image0
Wall Street analysts forecast ESLT stock price to fall over the next 12 months. According to Wall Street analysts, the average 1-year price target for ESLT is 408.51 USD with a low forecast of 367.01 USD and a high forecast of 450.00  USD. However, analyst price targets are subjective and often lag stock prices, so investors should focus on the objective reasons behind analyst rating changes, which better reflect the company's fundamentals.
0 Buy
2 Hold
0 Sell
Hold
down Image0
Current: 431.480
sliders
Low
367.01
Averages
408.51
High
450.00
down Image0
Current: 431.480
sliders
Low
367.01
Averages
408.51
High
450.00
See All Ratings
No Data

Valuation Metrics

The current forward P/E ratio for Elbit Systems Ltd (ESLT.O) is 38.06, compared to its 5-year average forward P/E of 2.40. For a more detailed relative valuation and DCF analysis to assess Elbit Systems Ltd 's fair value, click here.
    Forward PE
    Forward EV/EBITDA
    Forward PS

Forward PE

The forward P/E ratio is a valuation metric that divides a company's current stock price by its estimated future earnings per share over the next 12 months.
StronglyUndervaluedUndervaluedFairOvervaluedStronglyOvervalueddotted line Image
N/A
5Y Average PE
2.40
Current PE
38.06
Overvalued PE
11.28
Undervalued PE
-6.47

Forward EV/EBITDA

The forward EV/EBITDA ratio is a valuation metric that divides a company's enterprise value (EV) by its estimated future earnings before interest, taxes, depreciation, and amortization (EBITDA) over the next 12 months.
StronglyUndervaluedUndervaluedFairOvervaluedStronglyOvervalueddotted line Image
Strongly Overvalued
5Y Average EV/EBITDA
15.66
Current EV/EBITDA
22.55
Overvalued EV/EBITDA
18.28
Undervalued EV/EBITDA
13.05

Forward PS

The forward P/S ratio is a valuation metric that divides a company's current stock price by its estimated future sales (or revenue) per share over the next 12 months.
StronglyUndervaluedUndervaluedFairOvervaluedStronglyOvervalueddotted line Image
Strongly Overvalued
5Y Average PS
1.44
Current PS
2.40
Overvalued PS
1.73
Undervalued PS
1.16

Financials

Annual
Quarterly
N/A
Total Revenue
N/A
Operating Profit
N/A
Net Income after Tax
N/A
EPS - Diluted
N/A
Free Cash Flow
N/A
Gross Profit Margin - %
N/A
FCF Margin - %
N/A
Net Margin - %
N/A
ROIC

Trading Trends

    Insider
    Hedge Fund
    Congress Trading
Insider
Insiders are Neutral. There are no significant trading trends over the last month.
Sold
Bought
Hedge Fund
Hedge Funds are Neutral. There are no significant trading trends over the last quarter.
Sold
Bought
Congress Trading
Congress are Neutral. There are no significant trading trends over the last month.
Sold
Bought
Insider
Insiders are Neutral. There are no significant trading trends over the last month.
Sold
Bought

ESLT News & Events

Events Timeline

(ET)
2025-05-23
09:55:28
Jefferies aerospace,defense analysts hold analyst/industry conference call
select
link
2025-05-21 (ET)
2025-05-21
21:17:45
Elbit Systems 1.37M share Spot Secondary priced at $375.00
select
2025-05-21
16:56:14
Elbit Systems 1.37M share Spot Secondary; price range $375.00-$380.00
select
Sign Up For More Events

News

Preview
6.5
06-05WSJ
Opinion | Mideast Power Plays in India and Pakistan
  • Israel's Role in India-Pakistan Conflict: Israeli weapons, particularly drones, significantly contributed to India's military effectiveness during the recent conflict with Pakistan, showcasing the strong defense partnership between India and Israel.

  • Impact on Defense Supply Chains: The collaboration allows India to diversify its arms supply sources while enhancing Israel's market presence, benefiting both nations and aligning with U.S. interests as India moves closer to American allies.

Preview
6.0
06-03Newsfilter
S&P Global Ratings Maalot Raises Elbit Systems' Long Term Rating to "ilAA+" (Local Scale), With a Stable Outlook and Reaffirms Short Term Rating of "ilA-1+" (Local Scale)
  • Rating Upgrade: Elbit Systems Ltd. received an upgraded long-term rating of "ilAA+" from S&P Global Ratings Maalot, reflecting strong operating performance and a record-high backlog due to increased demand for its products amid geopolitical conflicts.

  • Company Overview: Elbit Systems is a leading global defense technology company with approximately 20,000 employees, reporting $1.9 billion in revenues for Q1 2025 and maintaining a substantial order backlog of $23.1 billion.

Preview
3.0
05-30NASDAQ.COM
Time to Buy Aerospace Defense Stocks for Higher Highs
  • Aerospace Defense Stocks Performance: Several Aerospace Defense stocks, including Howmet Aerospace and Safran, have reached new 52-week highs due to increased global military spending and rising earnings estimates, with year-to-date gains of +55% and +35% respectively.

  • Growth Potential in the Industry: The Zacks Aerospace-Defense Equipment Industry shows a projected EPS growth rate of 18.54% for 2025, with companies like Astronics and Elbit Systems outperforming expectations, indicating potential for further investment opportunities.

Sign Up For More News

People Also Watch

FAQ

arrow icon

What is Elbit Systems Ltd (ESLT) stock price today?

The current price of ESLT is 431.48 USD — it has increased 0.41 % in the last trading day.

arrow icon

What is Elbit Systems Ltd (ESLT)'s business?

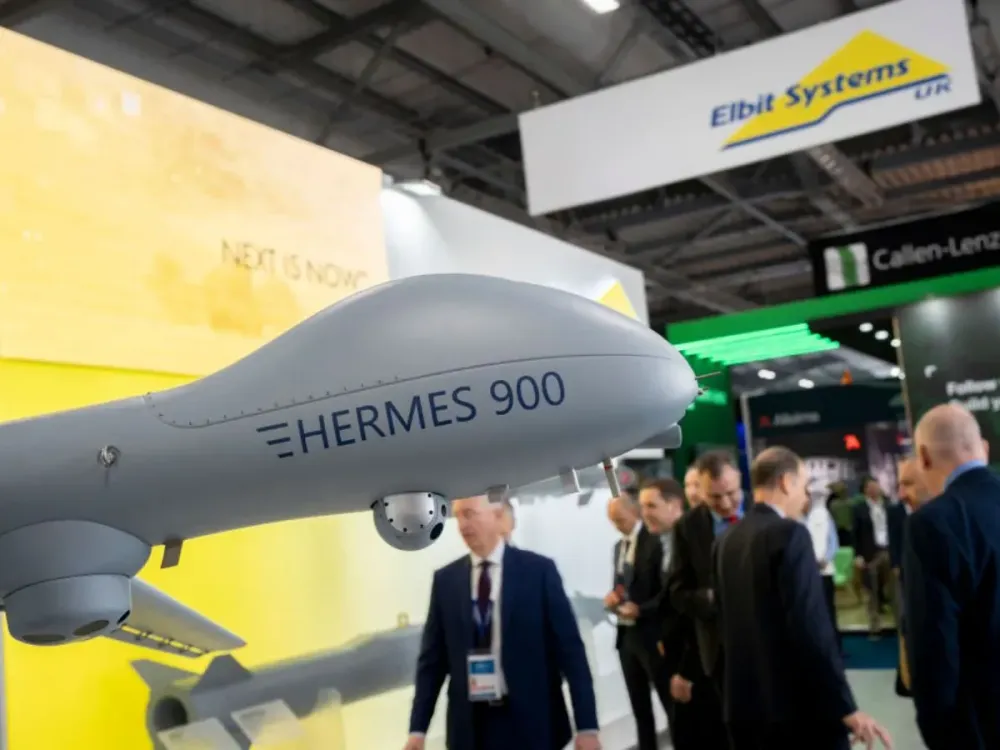
Elbit Systems Ltd. is an international technology company engaged in a range of programs across the world. The Company develops and supplies a portfolio of airborne, land and naval systems and products for defense, homeland security and commercial aviation applications. Its systems and products are installed on new platforms, and it also performs platform modernization programs. In addition, it provides a range of support services. The Company's activities include military aircraft and helicopter systems; helmet mounted systems; commercial aviation systems and aerostructures; unmanned aircraft and unmanned surface vessels; land vehicle systems; command, control, communications, computer and intelligence (C4I) systems; intelligence and cyber systems; electro-optic and countermeasures systems; electronic warfare and signal intelligence systems, and various commercial activities. It operates primarily in the defense and homeland security arenas.

arrow icon

What is the price predicton of ESLT Stock?

Wall Street analysts forecast ESLT stock price to fall over the next 12 months. According to Wall Street analysts, the average 1-year price target for ESLT is 408.51 USD with a low forecast of 367.01 USD and a high forecast of 450.00 USD. However, analyst price targets are subjective and often lag stock prices, so investors should focus on the objective reasons behind analyst rating changes, which better reflect the company's fundamentals.

arrow icon

What is Elbit Systems Ltd (ESLT)'s revenue for the last quarter?

Elbit Systems Ltd revenue for the last quarter amounts to 1.90B USD, increased 22.00 % YoY.

arrow icon

What is Elbit Systems Ltd (ESLT)'s earnings per share (EPS) for the last quarter?

Elbit Systems Ltd. EPS for the last quarter amounts to 2.40 USD, increased 45.45 % YoY.

arrow icon

What changes have occurred in the market's expectations for Elbit Systems Ltd (ESLT)'s fundamentals?

The market is revising Upward the revenue expectations for Elbit Systems Ltd. (ESLT) for FY2025, with the revenue forecasts being adjusted by 4.48% over the past three months. During the same period, the stock price has changed by 19.66%.
arrow icon

How many employees does Elbit Systems Ltd (ESLT). have?

Elbit Systems Ltd (ESLT) has 18984 emplpoyees as of June 13 2025.

arrow icon

What is Elbit Systems Ltd (ESLT) market cap?

Today ESLT has the market capitalization of 19.96B USD.

Intellectia LogoIntellectiaIntellectia LogoIntellectia

Redefine Your Investment Decisions

TwitterTwitterYoutubeYoutubeQuoraQuoraDiscordDiscordLinkedinLinkedinTelegramTelegram

Copyright © 2025 Intellectia.AI. All Rights Reserved.

pci certified logo
Company
HomeContactAbout UsNews Release
Compare
TradingViewSeeking Alpha
Features
Financial AI AgentStock Technical AnalysisStock MonitorHedge Fund TrackerCrypto Technical AnalysisAI ScreenerDaytrading Center
Strategies
AI Stock PickerSwing TradingStock Chart PatternsEarnings Trading
Free Tools
Dividend CalculatorDividend Yield CalculatorOptions Profit Calculator
Resource
BlogTutorialEarningsTrending StocksCrypto MarketPartner ProgramTerms of UsePrivacy PolicySitemap
Start for Free