ERII Overview
-
$
0.000
0.000(0.000%)
At close0.000(0.000%)Aft-market
ET
Loading chart...

The current price of ERII is 9.42 USD — it has increased 4.78
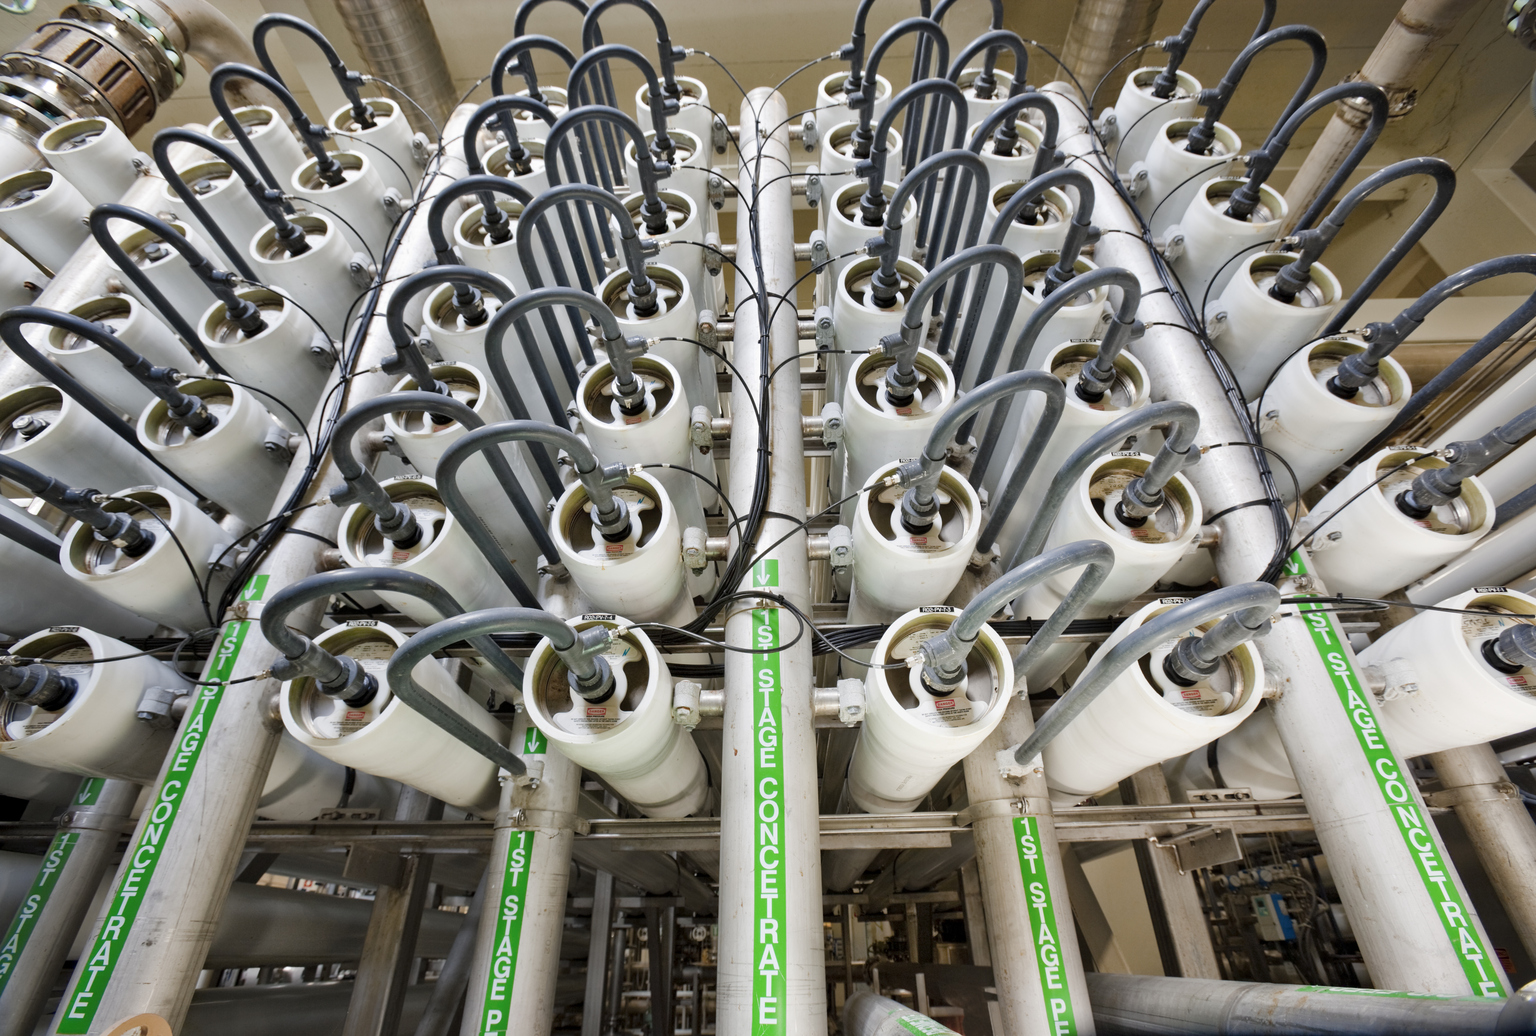
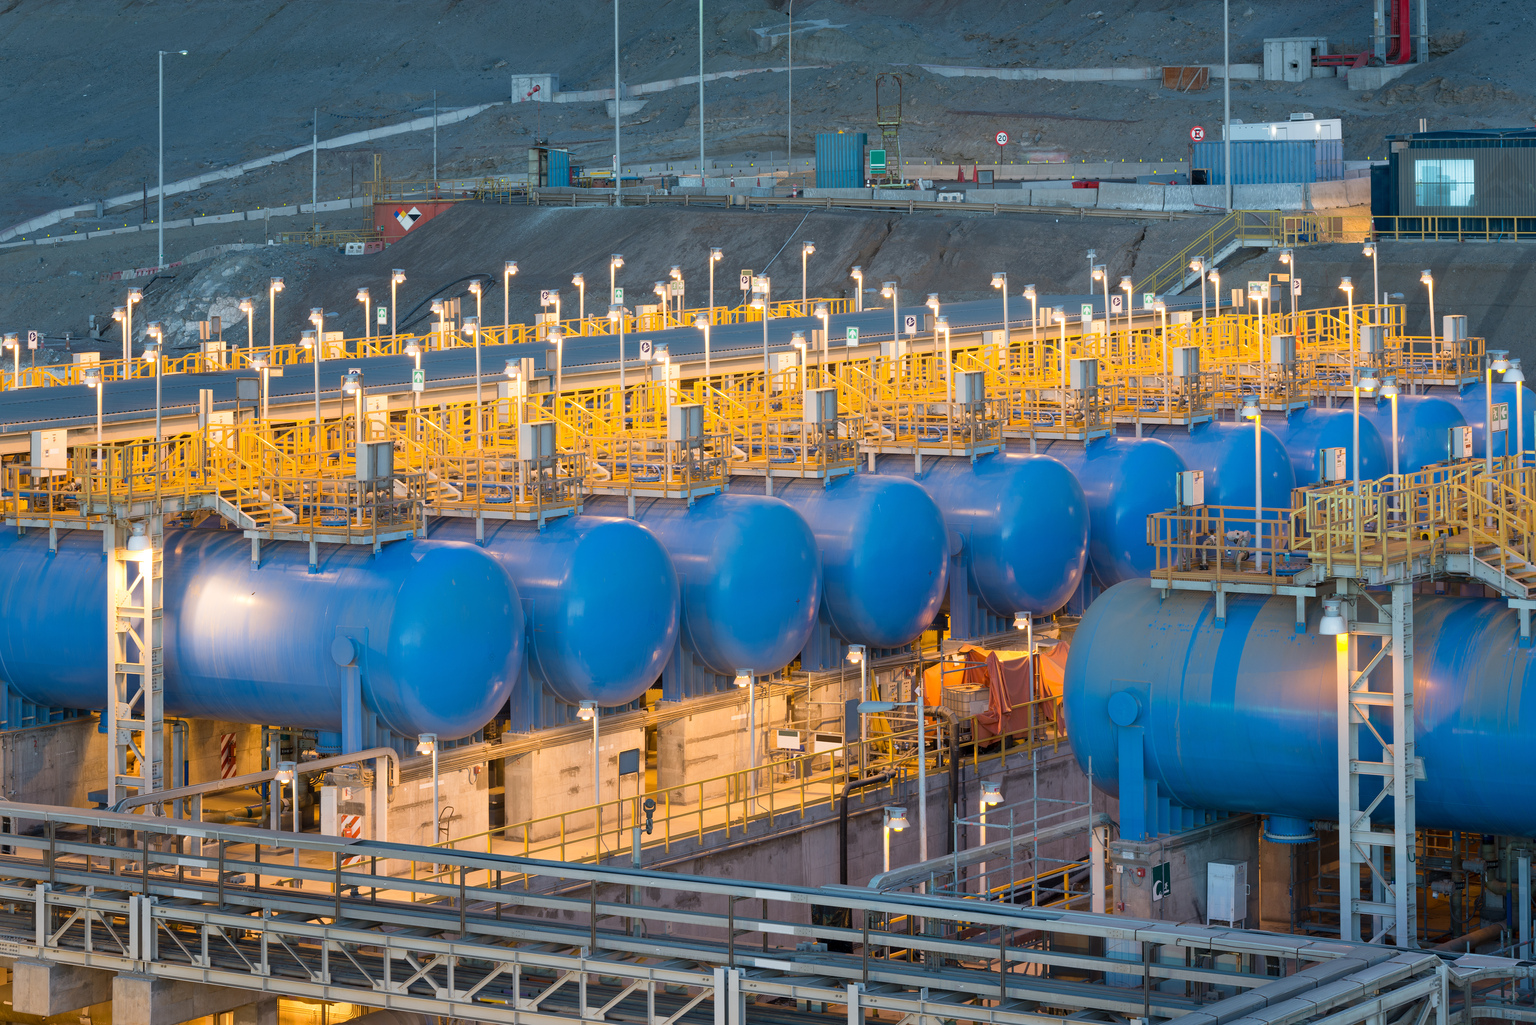
Energy Recovery, Inc. designs and manufactures energy-saving technology. The Company’s segments include Water and Emerging Technologies. The Water segment develops, sales and supports PX, hydraulic turbochargers and pumps used in seawater desalination and wastewater treatment activities. The Emerging Technologies segment develops, sales and supports activities related to emerging technologies, such as the PX G1300 used in industrial and commercial refrigeration applications. Its solutions are marketed, sold in, or developed for, the fluid-flow and gas markets, such as seawater and wastewater desalination, natural gas, chemical processing and CO2-based refrigeration systems, under the trademarks ERI, PX, Pressure Exchanger, PX Pressure Exchanger (PX), Ultra PX, PX G, PX G1300, PX PowerTrain, AT, and Aquabold. Its pressure exchanger technology acts like a fluid piston, transferring energy between high- and low-pressure liquid or gas through continuously rotating ducts.
Wall Street analysts forecast ERII stock price to rise over the next 12 months. According to Wall Street analysts, the average 1-year price target for ERII is19.50 USD with a low forecast of 16.00 USD and a high forecast of 23.00 USD. However, analyst price targets are subjective and often lag stock prices, so investors should focus on the objective reasons behind analyst rating changes, which better reflect the company's fundamentals.
Energy Recovery Inc revenue for the last quarter amounts to 9.71M USD, increased 20.35
Energy Recovery Inc. EPS for the last quarter amounts to -0.23 USD, increased 27.78
Energy Recovery Inc (ERII) has 230 emplpoyees as of June 21 2026.
Today ERII has the market capitalization of 485.56M USD.