iShares Currency Hedged MSCI EAFE Breaks Above 200-Day Moving Average - Bullish for HEFA
Stock Performance: HEFA's stock has a 52-week low of $31.39 and a high of $37.78, with the last trade recorded at $35.38.
Market Analysis Disclaimer: The opinions expressed in the article are those of the author and do not necessarily represent Nasdaq, Inc.
Trade with 70% Backtested Accuracy
Analyst Views on HEFA
About the author


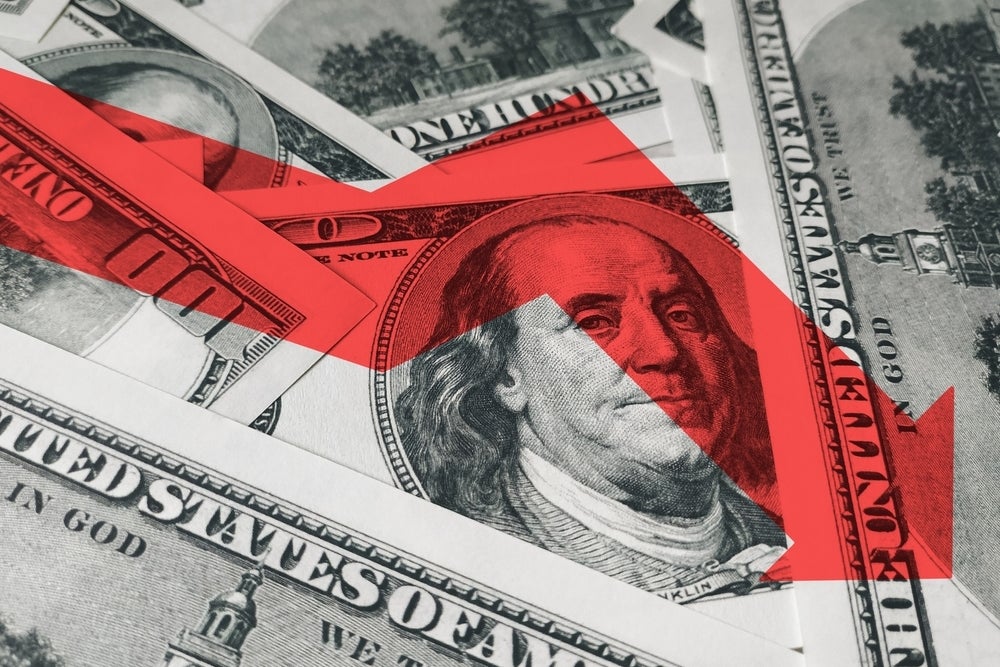
Significant ETF Withdrawals Observed - DBEF, STM, HEFA, MNDY
52-Week Range Analysis: DBEF's share price has a 52-week low of $37.8081 and a high of $47.90, with the last trade recorded at $47.85, indicating a stable position near its high.
Understanding ETFs: Exchange traded funds (ETFs) function like stocks, where investors buy and sell "units" that can be created or destroyed based on demand, impacting the underlying assets.
Monitoring ETF Flows: Weekly analysis of shares outstanding helps identify ETFs with significant inflows (new units created) or outflows (units destroyed), which can affect the individual components within those ETFs.
Author's Perspective: The opinions expressed in the article are solely those of the author and do not necessarily represent the views of Nasdaq, Inc.

Significant Withdrawals Observed in HEFA, EFA, TEVA, MNDY ETFs
HEFA Share Price Analysis: HEFA's share price is currently at $39.38, with a 52-week low of $31.7206 and a high of $39.60, indicating a stable position near its high point.
ETFs Trading Dynamics: ETFs function like stocks, allowing investors to buy and sell units that can be created or destroyed based on demand, impacting the underlying holdings significantly during notable inflows or outflows.
UUP Vs. The Herd: Contrarian Dollar ETFs In Focus As Sentiment Hits 20-Year Low
Wall Street's Sentiment on the Dollar: A recent survey shows that 37% of investors are underweight on the U.S. dollar, marking the highest level of bearish sentiment in two decades, presenting a potential contrarian opportunity for dollar-bullish ETFs like UUP and USDU.
Challenges with Alternative Currencies: Despite bearish sentiment towards the dollar, alternatives such as the euro, yen, and emerging market currencies face significant instability, making dollar-focused investments potentially more attractive during uncertain geopolitical conditions.

Noteworthy ETF Outflows: HEFA, EFA, SPOT, CYBR
Stock Performance: HEFA's current share price is $37.67, which is close to its 52-week high of $38.0829 and significantly above its low of $31.39.
ETF Dynamics: ETFs operate by trading units rather than shares, with the ability to create or destroy units based on investor demand, impacting the underlying holdings accordingly.

HEFA, EFA, SE, CYBR: Large Outflows Detected at ETF
Stock Performance Overview: HEFA's share price is currently at $37.26, within its 52-week range of $31.39 to $37.78, and the comparison with the 200-day moving average is noted as a useful analysis technique.
ETFs Trading Dynamics: ETFs function like stocks but involve trading 'units' that can be created or destroyed based on investor demand, impacting the underlying holdings significantly during notable inflows or outflows.
iShares Currency Hedged MSCI EAFE Breaks Above 200-Day Moving Average - Bullish for HEFA
Stock Performance: HEFA's stock has a 52-week low of $31.39 and a high of $37.78, with the last trade recorded at $35.38.
Market Analysis Disclaimer: The opinions expressed in the article are those of the author and do not necessarily represent Nasdaq, Inc.
Significant ETF Withdrawals Observed - DBEF, STM, HEFA, MNDY
52-Week Range Analysis: DBEF's share price has a 52-week low of $37.8081 and a high of $47.90, with the last trade recorded at $47.85, indicating a stable position near its high.
Understanding ETFs: Exchange traded funds (ETFs) function like stocks, where investors buy and sell "units" that can be created or destroyed based on demand, impacting the underlying assets.
Monitoring ETF Flows: Weekly analysis of shares outstanding helps identify ETFs with significant inflows (new units created) or outflows (units destroyed), which can affect the individual components within those ETFs.
Author's Perspective: The opinions expressed in the article are solely those of the author and do not necessarily represent the views of Nasdaq, Inc.
Significant Withdrawals Observed in HEFA, EFA, TEVA, MNDY ETFs
HEFA Share Price Analysis: HEFA's share price is currently at $39.38, with a 52-week low of $31.7206 and a high of $39.60, indicating a stable position near its high point.
ETFs Trading Dynamics: ETFs function like stocks, allowing investors to buy and sell units that can be created or destroyed based on demand, impacting the underlying holdings significantly during notable inflows or outflows.
UUP Vs. The Herd: Contrarian Dollar ETFs In Focus As Sentiment Hits 20-Year Low
Wall Street's Sentiment on the Dollar: A recent survey shows that 37% of investors are underweight on the U.S. dollar, marking the highest level of bearish sentiment in two decades, presenting a potential contrarian opportunity for dollar-bullish ETFs like UUP and USDU.
Challenges with Alternative Currencies: Despite bearish sentiment towards the dollar, alternatives such as the euro, yen, and emerging market currencies face significant instability, making dollar-focused investments potentially more attractive during uncertain geopolitical conditions.
Noteworthy ETF Outflows: HEFA, EFA, SPOT, CYBR
Stock Performance: HEFA's current share price is $37.67, which is close to its 52-week high of $38.0829 and significantly above its low of $31.39.
ETF Dynamics: ETFs operate by trading units rather than shares, with the ability to create or destroy units based on investor demand, impacting the underlying holdings accordingly.
HEFA, EFA, SE, CYBR: Large Outflows Detected at ETF
Stock Performance Overview: HEFA's share price is currently at $37.26, within its 52-week range of $31.39 to $37.78, and the comparison with the 200-day moving average is noted as a useful analysis technique.
ETFs Trading Dynamics: ETFs function like stocks but involve trading 'units' that can be created or destroyed based on investor demand, impacting the underlying holdings significantly during notable inflows or outflows.
iShares Currency Hedged MSCI EAFE Breaks Above 200-Day Moving Average - Bullish for HEFA
Stock Performance: HEFA's stock has a 52-week low of $31.39 and a high of $37.78, with the last trade recorded at $35.38.
Market Analysis Disclaimer: The opinions expressed in the article are those of the author and do not necessarily represent Nasdaq, Inc.


