Victory Capital Withdraws Bid for Janus Henderson Amid Market Dynamics
Written by Emily J. Thompson, Senior Investment Analyst
Updated: Mar 26 2026
0mins
Source: CNBC
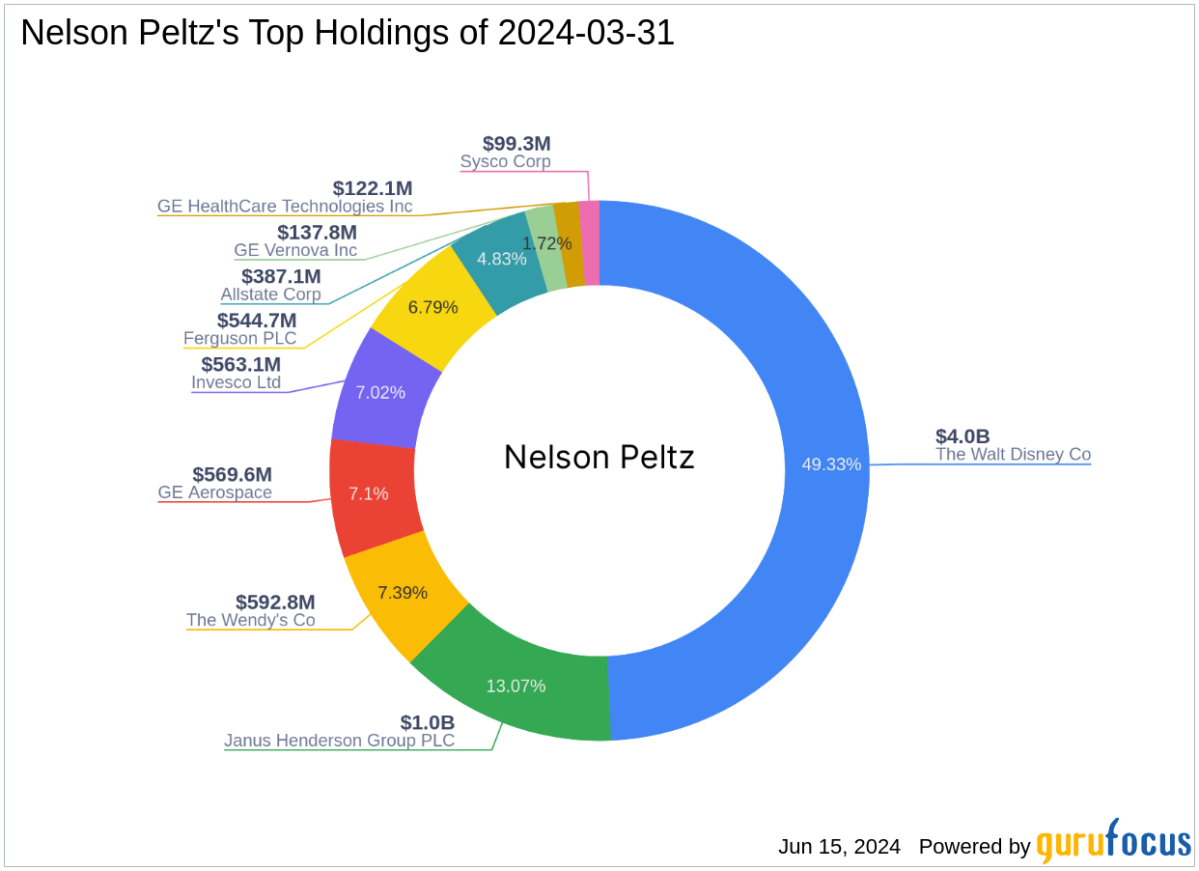
- Acquisition Dynamics: Victory Capital's withdrawal from the bid for Janus Henderson has led to its acquisition by General Catalyst and Trian, indicating a critical price discovery moment in the asset management industry, with the deal priced at a modest 11.6x forward earnings estimates.
- Fee Pressure: Asset management fees are trending lower, with ETFs providing a compelling low-cost alternative for many investors; however, the bidding war for Janus Henderson suggests that some asset management firms may be undervalued, capturing market attention.
- Invesco's Market Position: As a heavyweight in the industry, Invesco manages $2.26 trillion in assets, with its QQQ Trust essentially acting as a money-printing machine, and its current trading price is significantly below what a private equity firm would pay to build the business from scratch, highlighting its strong competitive moat.
- Options Trading Strategy: By structuring options trades to offset the dividend one would forgo by not purchasing the stock, investors can effectively acquire IVZ shares at about a 9% discount if the stock falls below $22, while also positioning for a maximum payout of $2 if the stock benefits from the JHG deal, showcasing a flexible investment strategy.
Trade with 70% Backtested Accuracy
Stop guessing "Should I Buy IVZ?" and start using high-conviction signals backed by rigorous historical data.
Sign up today to access powerful investing tools and make smarter, data-driven decisions.
Analyst Views on IVZ
Wall Street analysts forecast IVZ stock price to fall
11 Analyst Rating
4 Buy
7 Hold
0 Sell
Moderate Buy
Current: 28.790
Low
25.00
Averages
28.68
High
33.50
Current: 28.790
Low
25.00
Averages
28.68
High
33.50
About IVZ
Invesco Ltd. is an independent investment management firm. It serves the retail and institutional markets within the investment management industry in the Americas, Europe, Middle East, and Africa and Asia-Pacific in 120 countries. It offers a range of investment strategies across asset classes, investment styles, and geographies. Its asset classes include equity, fixed income, balanced, alternatives and money market. Its retail assets under management include exchange-traded funds, separately managed accounts, individual savings accounts, investment companies with variable capital, investment trusts, open-end mutual funds, unit investment trusts, and variable insurance funds. Its institutional assets include institutional separate accounts, private funds, open-end mutual funds, and collective trust funds. Its client base includes public and private entities, unions, non-profit organizations, endowments, foundations, financial institutions, and sovereign wealth funds.
About the author

Emily J. Thompson
Emily J. Thompson, a Chartered Financial Analyst (CFA) with 12 years in investment research, graduated with honors from the Wharton School. Specializing in industrial and technology stocks, she provides in-depth analysis for Intellectia’s earnings and market brief reports.

Comparing Growth ETFs: VONG vs RZG
- Expense Ratio Comparison: VONG's expense ratio stands at 0.06%, significantly lower than RZG's 0.35%, making VONG a more cost-effective choice for long-term investors seeking lower fees.
- Return Performance: As of June 17, 2026, RZG boasts a one-year return of 39.80%, substantially outperforming VONG's 20.30%, indicating that small-cap growth stocks may offer higher capital appreciation potential in the short term, albeit with increased volatility.
- Asset Size Impact: VONG manages $54.8 billion in assets, vastly exceeding RZG's $125.4 million, which not only enhances liquidity but also reduces transaction costs, giving VONG a competitive edge in the market.
- Sector Allocation Differences: VONG allocates 51% of its investments to the technology sector, while RZG diversifies across smaller companies in healthcare, technology, and industrials, leading to significant performance differences during market fluctuations.
See More

SpaceX IPO Soars, Market Awaits True Valuation Insights
- Stock Performance: On its third day of trading, SpaceX's stock peaked at $225 before closing at $201.68, indicating strong market demand, although concerns about potential overvaluation remain.
- Market Capitalization Comparison: At its peak, SpaceX's market cap surpassed Amazon's $2.65 trillion, reflecting investor optimism about its future potential while raising questions about the stock's valuation.
- Nasdaq Rule Changes: Nasdaq and FTSE Russell have amended index inclusion rules, allowing SpaceX to enter the Nasdaq 100 more quickly post-IPO, which will enhance its stock liquidity and market visibility.
- Price Discovery Process: Although SpaceX has been public for several days, a genuine price discovery process has yet to commence, and the upcoming expiration of lock-up periods in the coming weeks may increase market supply, potentially impacting stock price stability.
See More
Escalating Middle East Conflict Leads to Cautious Market Response
- Market Reaction: As hostilities in the Middle East escalate, investors are shifting from pricing in a ceasefire to anticipating a prolonged conflict, reflecting growing concerns over future geopolitical uncertainties.
- Oil Price Fluctuations: Despite a 2% rise in oil prices on Thursday, remaining below $100 per barrel, the market maintains optimism about its ability to cushion against supply shocks, primarily due to increased U.S. energy exports and strategic petroleum reserve releases.
- Rating Downgrade: Fitch Ratings has downgraded its global sovereign sector outlook from 'neutral' to 'deteriorating', forecasting that the U.S.-Iran conflict will weaken global growth, raise inflation and bond yields, and heighten geopolitical risks.
- Investment Strategy Adjustment: Investors are no longer viewing the conflict as a temporary inflation shock but are repricing the cost of capital, anticipating that rising energy costs and real capital costs will elevate earnings hurdles across the board.
See More
Invesco Launches Treasury BulletShares ETFs to Expand Defined Maturity Offerings
- Product Line Expansion: Invesco has launched BulletShares® Treasury Bond ETFs, significantly enhancing its defined maturity ETF platform and reinforcing its leadership in the fixed income ETF space, which is expected to attract more investors seeking liquidity and yield.
- Strong Market Demand: As of April 2026, target maturity ETFs have reached approximately $70 billion in assets under management, reflecting robust investor demand for bond-like maturity profiles, with Invesco's BulletShares capturing 40% of this market share.
- Flexible Investment Strategy: The newly launched Treasury ETFs provide investors with flexibility during periods of market uncertainty, helping them optimize their portfolios by locking in yields and managing reinvestment risks in a changing interest rate environment.
- Ongoing Innovation: Invesco plans to expand the maturity range of its investment-grade corporate and high-yield corporate BulletShares ETFs, further enriching its product lineup and demonstrating the company's ongoing commitment to innovation in the fixed income market.
See More
Invesco Reports 4.9% Increase in AUM to $2.45 Trillion
- AUM Growth: Invesco's assets under management (AUM) reached $2,453.9 billion at the end of May 2026, reflecting a robust 4.9% increase from the previous month, indicating strong performance in the asset management sector.
- Long-Term Inflows: The firm reported net long-term inflows of $18.9 billion for the month, demonstrating increased investor confidence and further solidifying its market position.
- Market Returns Impact: Favorable market returns contributed an increase of $96 billion to AUM, although foreign exchange fluctuations reduced AUM by $1.1 billion, yet the overall performance remains strong.
- Quarterly Average AUM: The preliminary average total AUM for the quarter ending May 31 was $2,331.3 billion, with active AUM at $1,175.6 billion, reflecting effective execution of the company's diversified investment strategies.
See More
Invesco Reports 4.9% Increase in AUM to $2.45 Trillion
- AUM Growth: Invesco's assets under management (AUM) reached $2.4539 trillion at the end of May 2026, reflecting a robust 4.9% increase from the previous month, indicating strong market performance and investor confidence.
- Strong Net Inflows: The firm reported net long-term inflows of $18.9 billion in May, demonstrating sustained demand for its investment products and further solidifying its market position amidst competitive pressures.
- Market Returns Impact: Favorable market returns contributed an increase of $96 billion to AUM, although foreign exchange fluctuations reduced AUM by $1.1 billion, showcasing the company's resilience in a volatile market environment.
- Quarterly Averages: The preliminary average total AUM for the quarter ending May 31 was $2.3313 trillion, with active AUM at $1.1756 trillion, highlighting the firm's stable growth and ongoing ability to attract investors in the asset management sector.
See More
Comparing Growth ETFs: VONG vs RZG
- Expense Ratio Comparison: VONG's expense ratio stands at 0.06%, significantly lower than RZG's 0.35%, making VONG a more cost-effective choice for long-term investors seeking lower fees.
- Return Performance: As of June 17, 2026, RZG boasts a one-year return of 39.80%, substantially outperforming VONG's 20.30%, indicating that small-cap growth stocks may offer higher capital appreciation potential in the short term, albeit with increased volatility.
- Asset Size Impact: VONG manages $54.8 billion in assets, vastly exceeding RZG's $125.4 million, which not only enhances liquidity but also reduces transaction costs, giving VONG a competitive edge in the market.
- Sector Allocation Differences: VONG allocates 51% of its investments to the technology sector, while RZG diversifies across smaller companies in healthcare, technology, and industrials, leading to significant performance differences during market fluctuations.
See More
SpaceX IPO Soars, Market Awaits True Valuation Insights
- Stock Performance: On its third day of trading, SpaceX's stock peaked at $225 before closing at $201.68, indicating strong market demand, although concerns about potential overvaluation remain.
- Market Capitalization Comparison: At its peak, SpaceX's market cap surpassed Amazon's $2.65 trillion, reflecting investor optimism about its future potential while raising questions about the stock's valuation.
- Nasdaq Rule Changes: Nasdaq and FTSE Russell have amended index inclusion rules, allowing SpaceX to enter the Nasdaq 100 more quickly post-IPO, which will enhance its stock liquidity and market visibility.
- Price Discovery Process: Although SpaceX has been public for several days, a genuine price discovery process has yet to commence, and the upcoming expiration of lock-up periods in the coming weeks may increase market supply, potentially impacting stock price stability.
See More
Escalating Middle East Conflict Leads to Cautious Market Response
- Market Reaction: As hostilities in the Middle East escalate, investors are shifting from pricing in a ceasefire to anticipating a prolonged conflict, reflecting growing concerns over future geopolitical uncertainties.
- Oil Price Fluctuations: Despite a 2% rise in oil prices on Thursday, remaining below $100 per barrel, the market maintains optimism about its ability to cushion against supply shocks, primarily due to increased U.S. energy exports and strategic petroleum reserve releases.
- Rating Downgrade: Fitch Ratings has downgraded its global sovereign sector outlook from 'neutral' to 'deteriorating', forecasting that the U.S.-Iran conflict will weaken global growth, raise inflation and bond yields, and heighten geopolitical risks.
- Investment Strategy Adjustment: Investors are no longer viewing the conflict as a temporary inflation shock but are repricing the cost of capital, anticipating that rising energy costs and real capital costs will elevate earnings hurdles across the board.
See More
Invesco Launches Treasury BulletShares ETFs to Expand Defined Maturity Offerings
- Product Line Expansion: Invesco has launched BulletShares® Treasury Bond ETFs, significantly enhancing its defined maturity ETF platform and reinforcing its leadership in the fixed income ETF space, which is expected to attract more investors seeking liquidity and yield.
- Strong Market Demand: As of April 2026, target maturity ETFs have reached approximately $70 billion in assets under management, reflecting robust investor demand for bond-like maturity profiles, with Invesco's BulletShares capturing 40% of this market share.
- Flexible Investment Strategy: The newly launched Treasury ETFs provide investors with flexibility during periods of market uncertainty, helping them optimize their portfolios by locking in yields and managing reinvestment risks in a changing interest rate environment.
- Ongoing Innovation: Invesco plans to expand the maturity range of its investment-grade corporate and high-yield corporate BulletShares ETFs, further enriching its product lineup and demonstrating the company's ongoing commitment to innovation in the fixed income market.
See More
Invesco Reports 4.9% Increase in AUM to $2.45 Trillion
- AUM Growth: Invesco's assets under management (AUM) reached $2,453.9 billion at the end of May 2026, reflecting a robust 4.9% increase from the previous month, indicating strong performance in the asset management sector.
- Long-Term Inflows: The firm reported net long-term inflows of $18.9 billion for the month, demonstrating increased investor confidence and further solidifying its market position.
- Market Returns Impact: Favorable market returns contributed an increase of $96 billion to AUM, although foreign exchange fluctuations reduced AUM by $1.1 billion, yet the overall performance remains strong.
- Quarterly Average AUM: The preliminary average total AUM for the quarter ending May 31 was $2,331.3 billion, with active AUM at $1,175.6 billion, reflecting effective execution of the company's diversified investment strategies.
See More
Invesco Reports 4.9% Increase in AUM to $2.45 Trillion
- AUM Growth: Invesco's assets under management (AUM) reached $2.4539 trillion at the end of May 2026, reflecting a robust 4.9% increase from the previous month, indicating strong market performance and investor confidence.
- Strong Net Inflows: The firm reported net long-term inflows of $18.9 billion in May, demonstrating sustained demand for its investment products and further solidifying its market position amidst competitive pressures.
- Market Returns Impact: Favorable market returns contributed an increase of $96 billion to AUM, although foreign exchange fluctuations reduced AUM by $1.1 billion, showcasing the company's resilience in a volatile market environment.
- Quarterly Averages: The preliminary average total AUM for the quarter ending May 31 was $2.3313 trillion, with active AUM at $1.1756 trillion, highlighting the firm's stable growth and ongoing ability to attract investors in the asset management sector.
See More