Chainlink: Factors Driving Price, Will It Stabilize Soon?


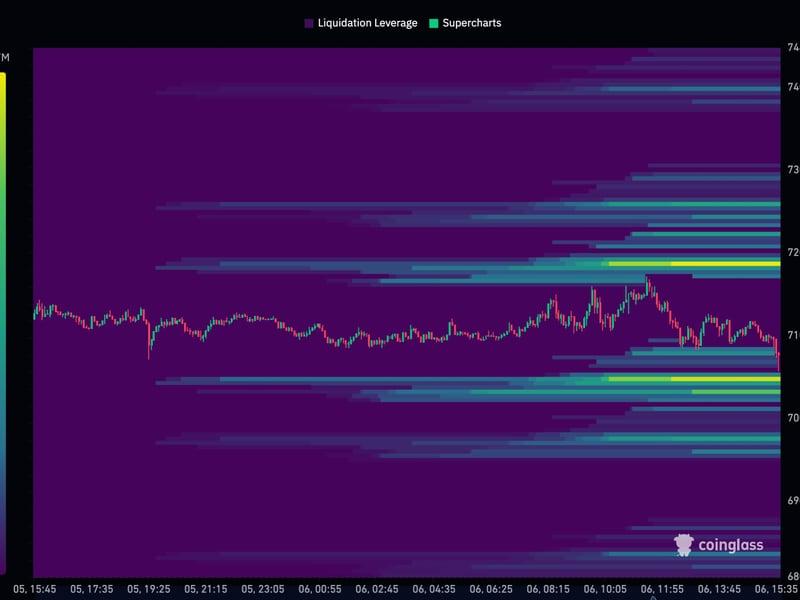
Current Market Position: Chainlink (LINK) is trading at $13.46, showing potential for a price breakout towards $18-$24 due to increased whale activity and strong support levels, with significant liquidations expected around $14.33.
Future Prospects: The upcoming SWIFT update in 2025 may enhance LINK's long-term value by promoting institutional adoption of crypto assets, while technical indicators suggest that maintaining support above $14.50-$15 could lead to further price increases.
Get Real-Time Alerts for Any Crypto Movement
Technical Analysis for HYPE
Technical Sentiment Analysis for Hyperliquid (HYPE). As of , Hyperliquid (HYPE) is exhibiting a Neutral technical sentiment. Our proprietary analysis, which aggregates 3 technical signals, shows that 2 indicators are flashing buy, while 1 are indicating sell.
Momentum Indicators: RSI, MACD & Overbought/Oversold Status. Currently, the Relative Strength Index (RSI) for HYPE stands at -, which suggests a Neutral condition. Meanwhile, the MACD (12, 26) indicator is at -, providing a Neutral signal for short-term momentum. Other oscillators like the Stochastic Oscillator at - and the Commodity Channel Index (CCI) at - further confirm a - outlook for the crypto.
Support, Resistance & Moving Averages. From a structural perspective, HYPE is trading below its 60-day moving average of $- and below its 200-day long-term moving average of $-. Key price levels to watch include the immediate resistance at $- and strong support at $-. A break above $- could signal a bull continuation, while falling below $- may test the next Fibonacci floor at $-.
Hyperliquid (HYPE) Support & Resistance Level
| Name | S3 | S2 | S1 | Pivot Points | R1 | R2 | R3 |
|---|---|---|---|---|---|---|---|
| Classic | 39.167 | 45.918 | 52.482 | 59.233 | 65.797 | 72.548 | 79.112 |
| Fibonacci | 45.918 | 51.005 | 54.147 | 59.233 | 64.32 | 67.462 | 72.548 |
About HYPE
About the author