
Key Takeaways
Netflix's valuation reveals a complex picture where Wall Street's optimistic price targets may overlook critical financial realities that smart investors should consider.
• Netflix trades above fair value: DCF analysis suggests a fair value of $79.7 versus current price of $85.36, indicating potential 7% overvaluation despite strong fundamentals.
• Hidden growth drivers emerge: Advertising revenue hit $1.5 billion in 2025 (growing 2.5x), while free cash flow reached $9.5 billion, outpacing earnings growth significantly.
• Operational excellence shines: Netflix maintains industry-leading churn rate below 2% with 325+ million subscribers and expanding operating margins to 24.5% in Q4 2025.
• PE ratio tells mixed story: At 35.5x, Netflix trades above industry average (20.2x) but below streaming peers (81.2x average) and well below historical norms.
• Wall Street targets miss key metrics: Consensus $120 price targets may overlook slower growth guidance and focus too heavily on short-term projections versus long-term cash flow potential.
While Netflix demonstrates strong operational performance and growing revenue streams, current valuation suggests the market may be pricing in optimistic scenarios that don't fully account for the company's transition to a more mature growth profile.
Netflix's valuation creates a puzzling situation for today's investors. The stock trades at $85.36, which sits above its estimated future cash flow value of $79.7. Wall Street analysts expect the price to rise more than 20% from current levels. This raises questions about whether they might be missing some significant metrics that tell a different story.
The company shows impressive performance despite signs of being overvalued. Fourth-quarter revenue jumped 17.6% compared to last year. Operating margins grew to 24.5% from 22.2%. Netflix's PE ratio of 35.5x looks good when compared to its peers who average 81.2x. However, this is expensive when you look at the US Entertainment industry's average of 20.2x. The company's fair value needs a closer look at its remarkable advertising revenue growth. This revenue multiplied 2.5 times in 2025 to reach $1.5 billion. The subscriber base has also grown beyond 325 million paid memberships.
This analysis will help you find why standard valuation metrics might overlook significant factors that affect Netflix's true market value. You'll learn how to assess whether the current price offers a good chance or poses a risk.
How Wall Street Sets Price Targets for Netflix
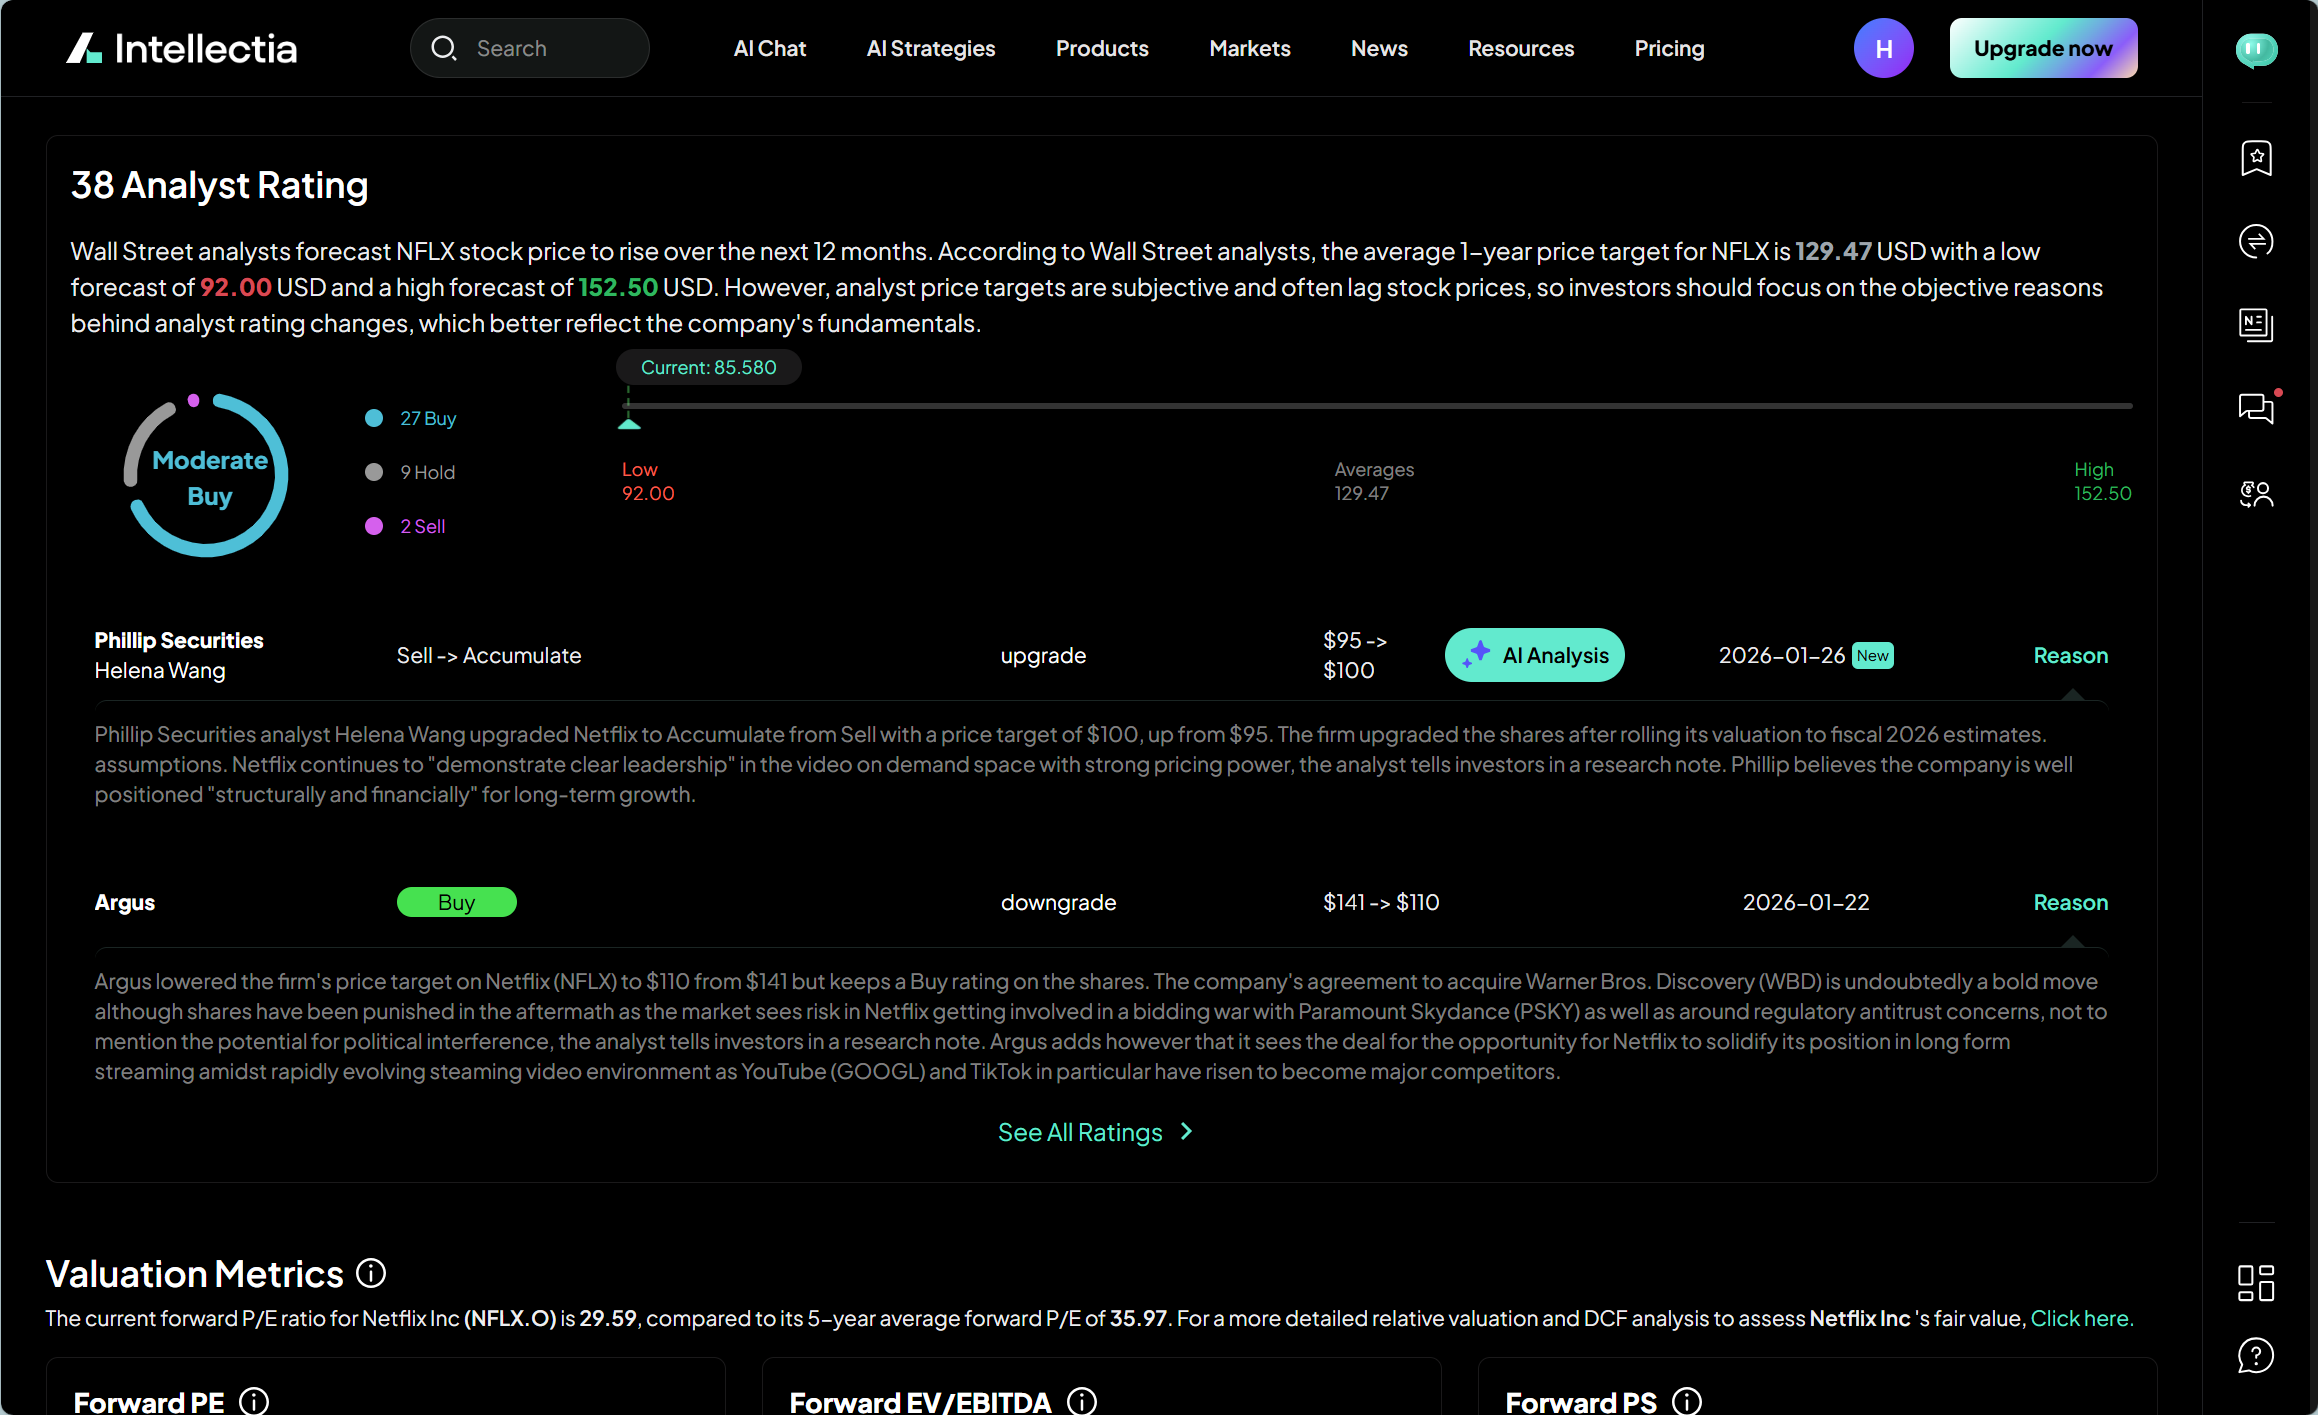
Wall Street analysts keep updating Netflix's price targets. They use complex valuation models that combine current performance metrics with future growth projections. The consensus among analysts puts Netflix's average 12-month price target at $120. This represents about 40% upside potential from recent trading prices. The targets show wide variation, ranging from $77 to $160.
Analyst Forecast Models and Assumptions
Financial analysts use two main valuation approaches to determine Netflix's fair value. They use Discounted Cash Flow (DCF) models that project future cash flows and discount them to present value. A typical DCF model starts with Netflix's last twelve month free cash flow of $9.10 billion. It then projects steady growth to reach $31 billion by 2035. Analysts also compare metrics like Price-to-Earnings (P/E) ratios. Netflix's current P/E of 38.55x stands against the entertainment industry average of 20.34x.
Trailing Twelve Month (TTM) Data Usage
TTM data helps analysts establish baseline performance metrics for Netflix. This method uses the most recent four quarters of financial results to balance seasonal changes. Stock Analysis shows Netflix's TTM free cash flow reached $9.46 billion - a 36.7% increase from last year. The TTM free cash flow margin grew to 20.94% of revenue from 17.75% a year earlier. These trailing metrics help analysts make forward projections.
Limitations of Consensus Price Targets
Consensus price targets have clear limitations in Netflix valuation. Recent analyzes show targets ranging from $95 to $152. This wide range shows analysts disagree about Netflix's fundamental value. Analysts often revise their targets after earnings reports, as seen in recent target cuts. Most analyst targets focus on 12-month price predictions rather than long-term valuation methods. This approach might miss Netflix's extended growth potential. Targets also reflect different views on key metrics like advertising revenue growth, operating margin expansion, and subscriber acquisition costs.
Netflix PE Ratio vs Fair Value Estimates
Price-to-earnings (PE) ratio serves as a core valuation metric to evaluate Netflix stock. This metric has become even more relevant since Netflix's profitability became stable. A closer look at this indicator helps us learn about market expectations and potential investment value.
Current PE Ratio: 35.5x vs Industry Average
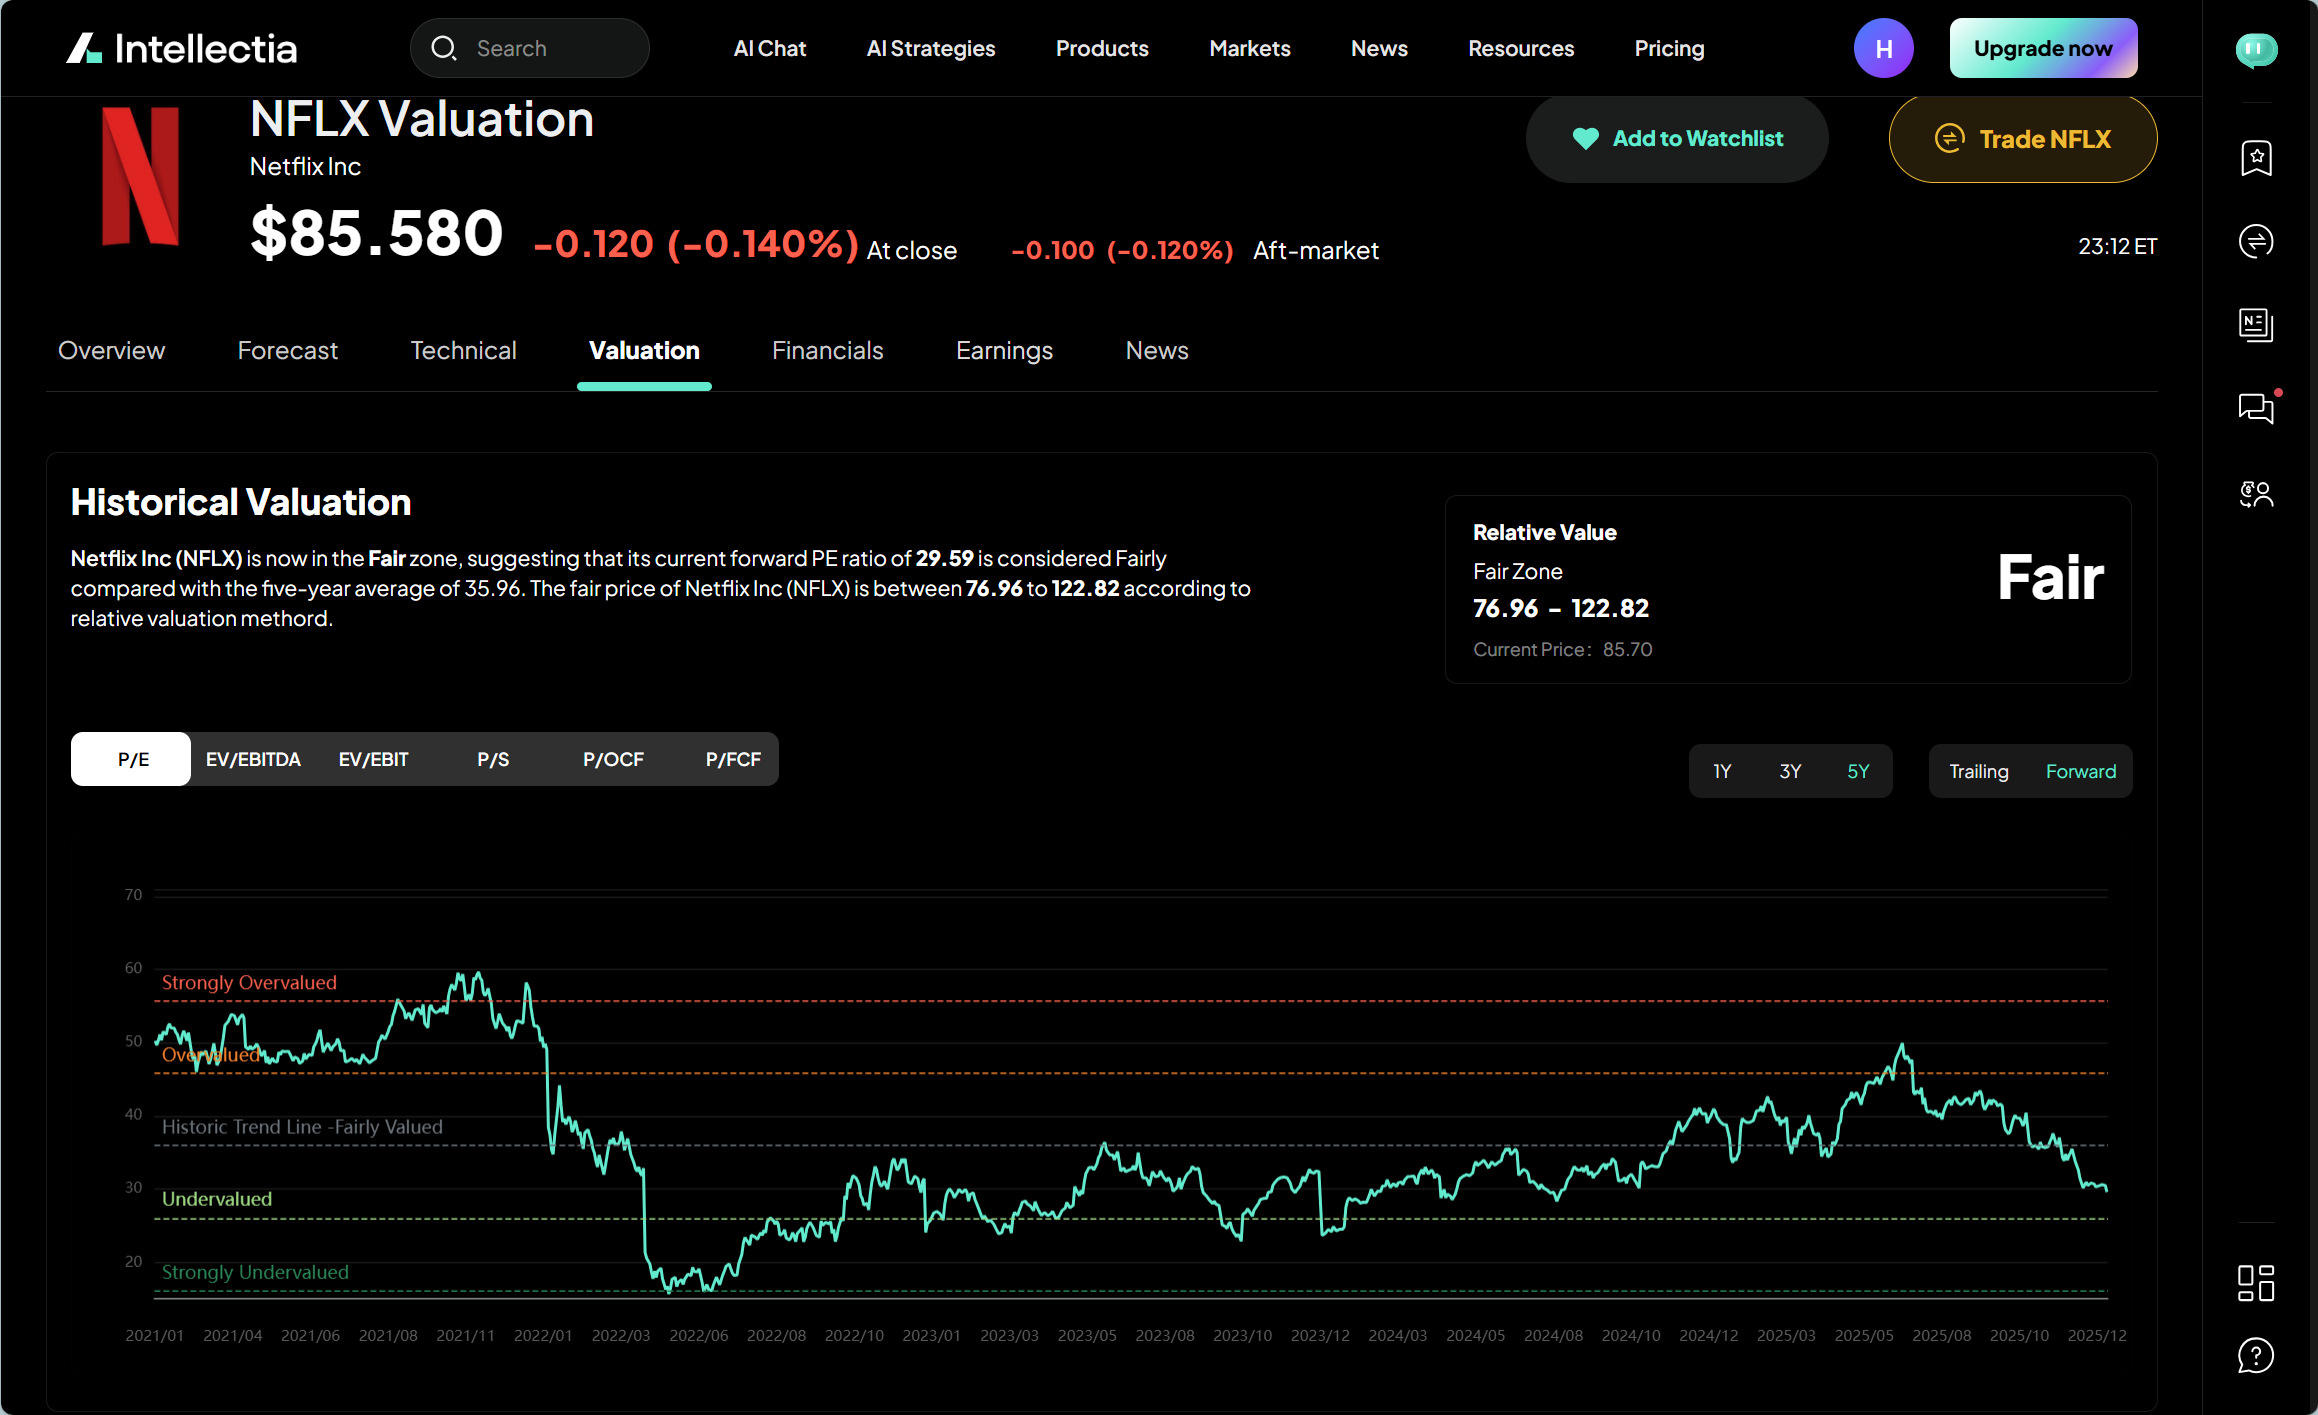
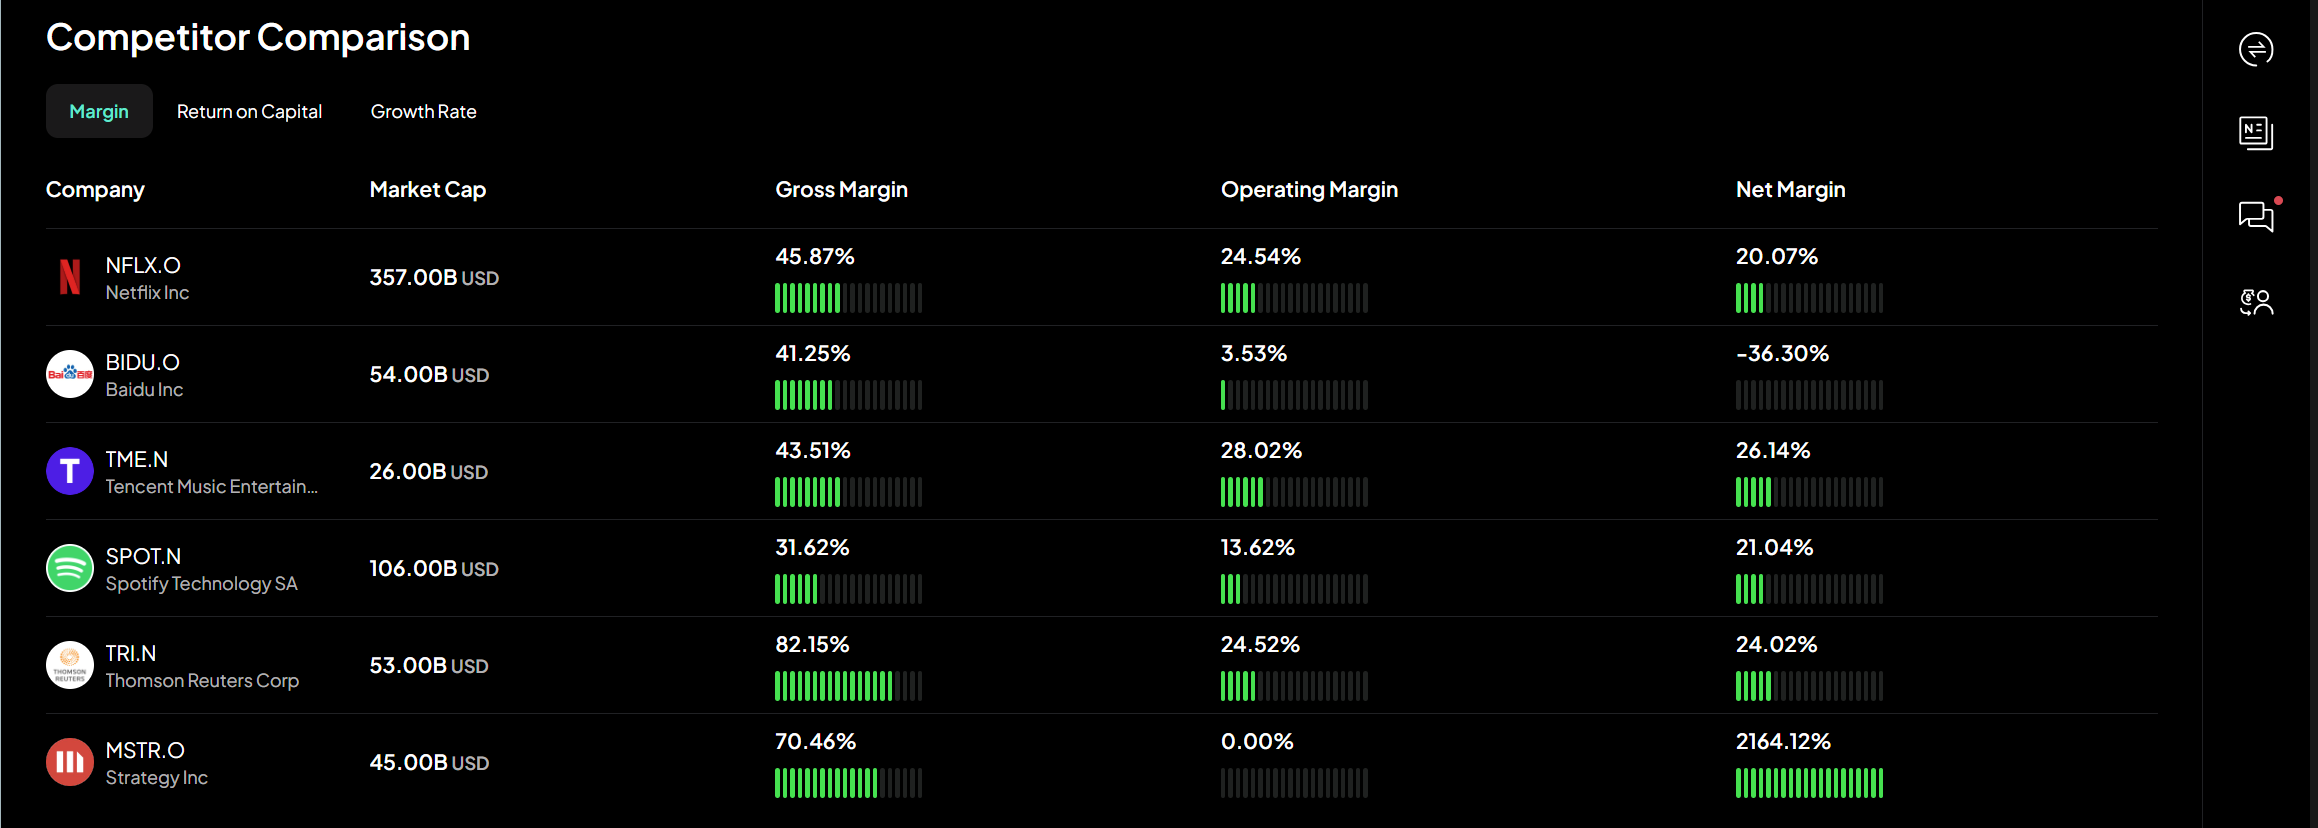
Netflix's current PE ratio stands at 35.5x, based on its latest earnings per share of about $10.98 billion. This ratio is by a lot higher than the US Entertainment industry's average of 20.2x, which shows investors pay a premium for Netflix shares. The company's valuation looks reasonable when compared to direct competitors, whose average PE is much higher at 81.2x. This is a big deal as it means that while Netflix trades above the broader industry average, it still offers better value than many streaming competitors.
Fair PE Ratio Calculation: 33.8x Based on Growth and Risk
Netflix's fair PE ratio comes in at 33.8x. This calculation takes into account the company's growth projections, profit margins, business risk profile, and market position. So, with Netflix's actual PE ratio at 35.5x, the stock trades slightly above its calculated fair value. This assessment looks at Netflix's earnings growth outlook, profitability levels, industry position, and risk factors to find the right multiple. The current PE sits about 5% above the fair ratio, which suggests Netflix is slightly overvalued based on this metric alone.
Netflix Stock Valuation vs Historical PE Trends
Historical trends tell an interesting story about Netflix's current valuation. The company's average PE ratio in the last 3 years was 42.97x, higher than today's level. The 5-year average reaches 41.55x. The most striking fact is that Netflix's current PE of 34.84x is 66% lower than its 10-year historical average of 103.04x. This huge drop from past levels shows Netflix's progress from an innovator to a 15-year old profitable business. The stock hit its highest PE of 340.77x in March 2016 and its lowest at 15.21x in June 2022.
DCF Valuation Model: What Wall Street Overlooks
Discounted Cash Flow (DCF) models paint a different picture of Netflix's value than what most headlines suggest. DCF looks at future cash-generating ability over longer periods and often finds value gaps that conventional analysis misses.
Discounted Cash Flow Inputs: Revenue, Margin, FCF
Netflix DCF models start with revenue projections that show growth reaching about $63.9 billion by 2029. Operating margins are crucial inputs that could expand to 32% by 2029. Free Cash Flow (FCF) stands out as the most important factor. The current FCF of $9.10 billion could more than double to nearly $20.60 billion by 2029.
NFLX Fair Value Estimate: $79.7 vs Market Price
The numbers tell an interesting story. Most complete DCF models suggest Netflix's fair value sits below its current trading price. The stock trades at $85.36, while the estimated DCF value of $79.7 points to a 7% overvaluation. Different models show varying results from $60.74 to $82.42, but they mostly agree the stock is overvalued.
Impact of Slower Growth Guidance on DCF Output
Recent changes in growth guidance have changed valuation models significantly. Analysts first thought Netflix would keep double-digit revenue growth rates through the next decade. New models now use more conservative growth rates that drop from 16% to 9% over the next five years. This change alone cuts fair value estimates by 15-20% in most models.
Why DCF Captures Long-Term Value Better Than PE
DCF analysis gives better insight into long-term value because it considers cash flow timing, growth patterns, and risk adjustments. PE ratios can't include these factors. DCF looks at Netflix's business rise over many years and includes improvements in margin expansion and capital efficiency, while PE ratios only provide a snapshot view.
Key Metrics Wall Street Misses in Netflix Valuation
Standard Wall Street analyzes often miss some vital performance indicators that reveal Netflix's true valuation potential. These metrics paint a more complete picture of the company's future.
Free Cash Flow Growth vs Earnings Growth
Netflix's free cash flow is growing faster than its earnings, which shows excellent financial efficiency. FCF hit $9.50 billion in 2025, up from $6.90 billion in 2024, and we expect it to reach about $11.00 billion in 2026. The operating income reached $3.00 billion in Q4, showing a 30% jump from last year.
Advertising Revenue Contribution in 2025
Wall Street often overlooks advertising revenue in their valuation models. This revenue stream hit $1.50 billion in 2025—about 3% of total annual revenue. The numbers grew 2.5 times compared to 2024, and experts predict it will double to around $3.00 billion in 2026.
Subscriber Base Expansion and Churn Rate
Netflix grew its global subscriber count to 325 million by the end of 2025, adding 23 million new subscribers that year. The company leads the industry with a churn rate below 2%. Even better, 61% of subscribers who cancel end up coming back within a year.
Operating Margin Expansion: 24.5% in Q4 2025
The Q4 operating margin reached 24.5%, growing two percentage points from last year. Netflix aims for a 31.5% operating margin in 2026, which clearly shows improving profitability.
Currency-Neutral Revenue Forecast for 2026
Netflix expects 2026 revenue between $50.70-$51.70 billion, with 11-13% currency-neutral growth.
The Intellectia.ai AI Screener can help you find other companies with similar hidden strengths. This tool helps filter the market for companies that show clear signs of growth—maybe finding suppliers to major tech firms or competitors who are ramping up their investments.
Conclusion
Netflix creates a puzzling valuation challenge for investors. Strong performance metrics and growth tell one story, while traditional valuation models suggest the streaming giant trades above fair value. Wall Street's optimistic price targets clash with DCF-based fair value estimates of $79.7, which shows how complex it is to value this entertainment powerhouse.
A deeper look at key metrics reveals Netflix's future potential. The company's free cash flow grows by a lot faster than earnings. Its advertising revenue should hit $1.5 billion in 2025, and its subscriber base tops 325 million. These strengths don't show up fully in standard analyzes. The company's exceptional 24.5% operating margin and industry-leading churn rate below 2% showed operational excellence that needs careful thought in any full picture.
Smart investors should look past PE ratios and analyst price targets when sizing up Netflix as an investment. The company knows how to expand margins while growing subscribers. This creates a strong foundation for future success, even though current prices might not be an immediate bargain based on DCF models.
The streaming world keeps changing, yet Netflix holds its leadership spot through content investments and platform breakthroughs. The AI Stock Picker gives analytical insights and daily recommendations quickly.
Netflix's true value probably sits between Wall Street's optimistic views and conservative DCF estimates. Your investment choice should weigh the company's solid track record against its current premium price, and with good reason too. Netflix might seem pricey by traditional metrics, but its strong financial path and growing revenue streams could justify the market's faith in its future.