
Key Takeaway
Bitcoin enters mid-April 2026 trading at approximately $77,476, positioned at a critical technical juncture that will likely define price action for the coming months. The cryptocurrency has established a well-defined trading range between $70,000 support and $76,000 resistance, with institutional capital flows providing unprecedented underlying demand through spot Bitcoin ETFs. BlackRock's iShares Bitcoin Trust (IBIT) alone attracted $284 million in single-day inflows on April 17, 2026, demonstrating that institutional adoption has evolved from speculative curiosity to strategic portfolio allocation.
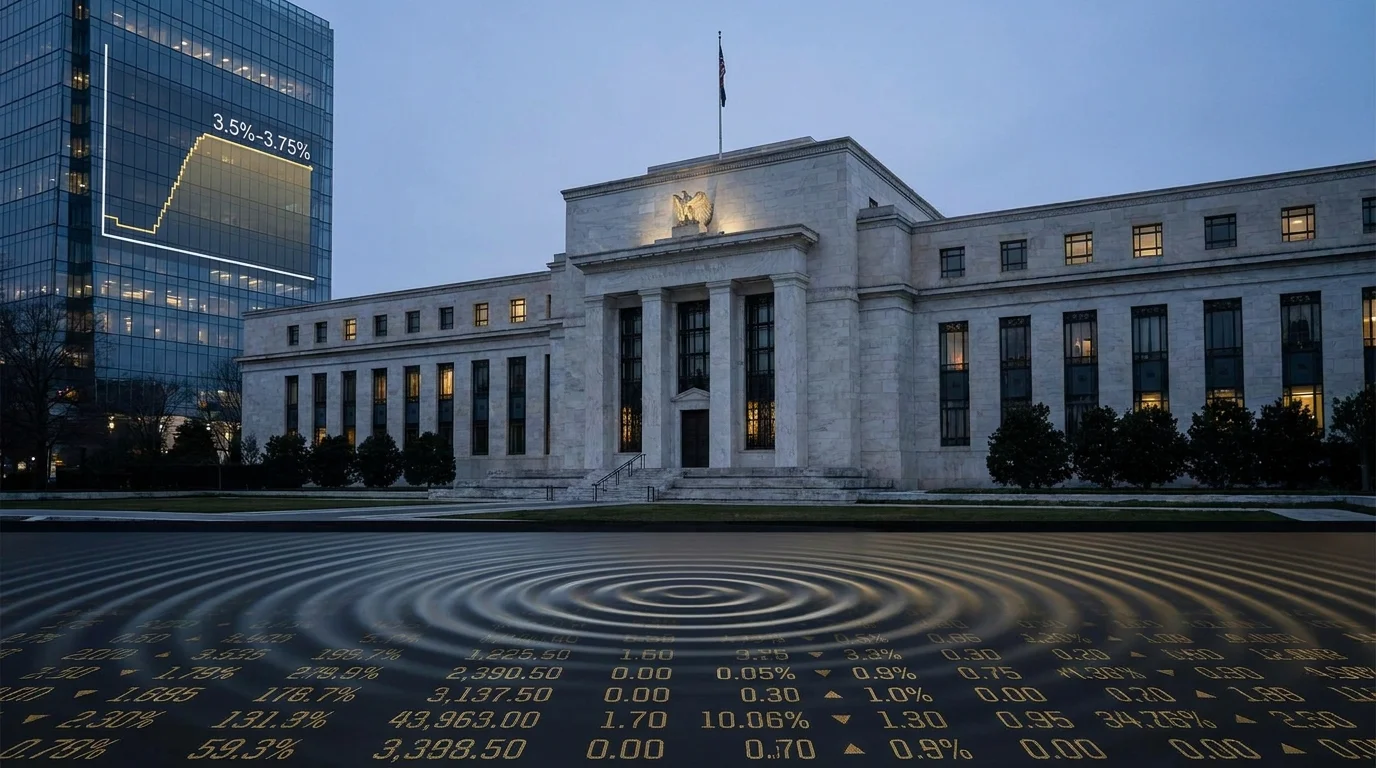
The convergence of technical structure and fundamental catalysts creates a compelling setup for Bitcoin in 2026. On the technical front, the $75,000 level aligns with both psychological significance and the 100-day moving average, while $77,500 represents the next major resistance hurdle that could unlock a move toward $85,000-$90,000 if breached. Simultaneously, macroeconomic conditions are shifting in Bitcoin's favor, with UBS forecasting 50 basis points of Federal Reserve rate cuts by year-end that would bring the federal funds rate to 3.00%-3.25%. Former Federal Reserve Chair Janet Yellen's recent warning about potential dollar hyperinflation has further amplified Bitcoin's appeal as a hedge against currency debasement.
Investors should recognize that Bitcoin currently trades within a maturing market structure characterized by slower, more deliberate price action compared to previous cycles. The "lame year" cycle theory suggests 2026 may see prolonged consolidation following the October 2025 peak of $126,000, potentially creating a 30-50% drawdown scenario before the next leg higher. However, the structural demand from institutional ETF accumulation, combined with Bitcoin's position more than 50% through its current halving cycle, suggests that any significant dips are likely to be met with aggressive buying from long-term holders and institutional participants.
Current Market Structure and Price Action
Bitcoin's price action in April 2026 reflects a market in equilibrium, with buyers and sellers engaged in a tug-of-war around the $74,000-$77,000 zone. Following six failed attempts to sustain a break above $76,000 over the past two months, Bitcoin has demonstrated remarkable resilience in holding above the $70,000-$72,000 support region. This consolidation pattern suggests accumulation by sophisticated market participants who view current levels as attractive entry points for long-term positioning.
The daily chart reveals several important technical observations that inform near-term expectations. The Moving Average Convergence Divergence (MACD) indicator maintains a bullish posture with a positive histogram, suggesting that momentum remains skewed toward the upside despite recent volatility. The Connors Relative Strength Index (CRSI) reading of 63.53 indicates neutral-to-bullish conditions, providing room for further upside before reaching overbought territory. Additionally, the Alligator indicator has entered a coiled configuration, which historically precedes significant directional moves as volatility compresses and eventually expands.
Trading volume patterns during April reveal institutional footprint characteristics, with elevated activity during U.S. market hours coinciding with ETF creation/redemption flows. The correlation between spot Bitcoin price movements and ETF fund flows has strengthened considerably, with inflows typically preceding price appreciation by 24-48 hours. This relationship underscores the importance of monitoring daily ETF flow data as a leading indicator for short-term price direction. When ETF inflows remain steady while derivatives market leverage metrics such as funding rates and open interest remain contained, market structure suggests relatively healthy conditions dominated by long-term capital rather than speculative excess.
Technical Analysis: Support and Resistance Levels
Understanding Bitcoin's technical landscape requires careful examination of the key price levels that have governed trading activity throughout 2026. These levels serve as decision points where supply and demand dynamics shift, creating opportunities for informed trading and investment decisions.
Immediate Resistance Zones
The $75,000 level represents the first significant resistance Bitcoin must overcome to establish a sustainable uptrend. This level carries dual significance as both a round psychological number and the precise location of the 100-day moving average, a widely tracked trend indicator that often serves as dynamic support during bull markets and resistance during bearish phases. A decisive daily close above $75,000 would signal renewed bullish momentum and likely trigger algorithmic buying programs that reference this widely-watched technical level.
Above $75,000, the $76,950-$77,500 zone emerges as the next major resistance confluence. This range encompasses recent local highs that have capped price advances on multiple occasions, creating a supply zone where previous buyers may look to exit positions at breakeven. The $77,500 level holds particular importance as a psychological target that, if breached, could catalyze a rapid move toward $80,000 and potentially $85,000 as short positions are forced to cover and momentum traders enter long positions.
Critical Support Levels
On the downside, $73,180 serves as the most important immediate support level, representing recent consolidation lows that have held under repeated testing. A breach of this level would likely accelerate selling pressure toward the $71,000-$72,000 range, where the 200-day moving average currently resides. The $70,000 level carries profound psychological significance as the previous cycle high from 2021, and many analysts view sustained trading above this level as confirmation that Bitcoin has transitioned into a new structural bull market.
The $70,000-$72,000 support zone has demonstrated remarkable resilience throughout April 2026, absorbing multiple selling waves triggered by macroeconomic concerns and geopolitical tensions. Each test of this support has been met with aggressive buying, suggesting that institutional accumulation programs and long-term holder conviction remain strong. A daily close below $70,000 would represent a significant technical breakdown that could trigger a deeper correction toward $65,000 or even $60,000, though current market structure makes such a scenario appear relatively unlikely in the near term.
Institutional Adoption Surge: The ETF Revolution
The most transformative development in Bitcoin markets during 2026 has been the acceleration of institutional adoption through spot Bitcoin exchange-traded funds. These regulated investment vehicles have fundamentally altered Bitcoin's market structure by providing traditional investors with familiar, compliant access to cryptocurrency exposure through their existing brokerage accounts.
Record-Breaking ETF Inflows
The first quarter of 2026 witnessed unprecedented capital flows into spot Bitcoin ETFs, with total inflows reaching $18.7 billion according to data from CoinGlass. This figure represents a dramatic acceleration from Q4 2025 and demonstrates that Bitcoin ETFs have transcended their initial role as convenient retail investment vehicles to become essential tools for institutional portfolio construction. BlackRock's iShares Bitcoin Trust (IBIT) has emerged as the dominant player, accumulating over 773,000 BTC and establishing itself as the largest Bitcoin investment vehicle globally.
The magnitude of institutional demand became particularly evident on April 17, 2026, when BlackRock's IBIT attracted $284 million in single-day inflows. This extraordinary daily flow highlights the persistent buying pressure from institutional investors who view Bitcoin allocation as a strategic imperative rather than speculative positioning. The consistency of inflows, even during periods of price weakness, suggests that many institutions are implementing dollar-cost averaging strategies with multi-year investment horizons.
Morgan Stanley's Market Entry
April 2026 marked a watershed moment for institutional Bitcoin adoption with Morgan Stanley's launch of its proprietary Bitcoin ETF, ticker symbol MSBT. As one of the largest wealth managers globally, Morgan Stanley's entry into the Bitcoin ETF space carries profound implications for market dynamics. The firm had already accumulated $1.24 billion in spot Bitcoin ETF exposure through BlackRock's IBIT before launching its own product, demonstrating serious conviction in the asset class.
Morgan Stanley's MSBT recorded $14.9 million in inflows during its first week, which company leadership described as the bank's strongest ETF launch by early adoption metrics. The structural advantage of MSBT lies in its integration with Morgan Stanley's wealth management platform, allowing the firm's thousands of financial advisors to recommend a proprietary product whose management fee flows back to Morgan Stanley rather than to third-party providers like BlackRock or Fidelity. This alignment of incentives is likely to drive continued recommendation of Bitcoin exposure to high-net-worth clients seeking portfolio diversification.
Fidelity and Invesco Expansion
Fidelity has maintained its position as the second-largest Bitcoin ETF provider, with its Wise Origin Bitcoin Fund continuing to attract significant inflows. The firm's $25 million Bitcoin purchase in April 2026, disclosed alongside its ETF activities, demonstrates that Fidelity views Bitcoin as an attractive asset for its own corporate treasury in addition to offering client exposure. Invesco has also expanded its market presence, with its Galaxy Bitcoin ETF contributing meaningfully to aggregate inflow totals.
The combined impact of these institutional flows has created a structural bid for Bitcoin that absorbs a significant portion of daily sell pressure from miners, early holders taking profits, and leveraged traders facing liquidations. As of April 2026, approximately 1.32 million BTC remain unmined, representing less than 7% of total supply, while an estimated 3-4 million BTC are considered permanently lost due to forgotten keys or destroyed wallets. This shrinking effective float means that demand increasingly competes for an increasingly fixed supply pool, creating favorable supply-demand dynamics for price appreciation.

Federal Reserve Policy and Macroeconomic Impact
Bitcoin's price trajectory in 2026 remains inextricably linked to Federal Reserve monetary policy and broader macroeconomic conditions. The interplay between interest rates, inflation expectations, and dollar strength creates the fundamental backdrop against which Bitcoin's digital scarcity narrative resonates with investors.
Current Fed Stance and Market Pricing
The Federal Open Market Committee voted on March 18, 2026, to maintain the federal funds target range at 3.50% to 3.75%, extending the pause in rate adjustments that began in late 2025. This decision reflected the Fed's assessment that inflation, while moderating from 2022 peaks, remained above the 2% target with recent readings suggesting sticky price pressures. The March 2026 inflation forecast was revised higher to 2.7%, indicating that the central bank anticipates a more gradual return to target than previously projected.
Market participants have interpreted the Fed's cautious stance as creating a relatively neutral environment for risk assets including Bitcoin. The CME FedWatch Tool indicates approximately 40% probability of zero rate cuts in 2026, suggesting that markets have priced in a higher-for-longer rate environment. However, this expectation has shifted dramatically in recent weeks as new data and policy developments emerge.
UBS Rate Cut Forecast
Wall Street banking giant UBS has emerged with a more dovish outlook, forecasting 50 basis points of Federal Reserve rate cuts later in 2026. UBS economists project two 25 basis point reductions potentially occurring in September and December, which would bring the federal funds rate to approximately 3.00%-3.25% by year-end. Fed Governor Stephen Miran has downplayed inflation risks from the U.S.-Iran conflict and ongoing tariff disputes, suggesting that the central bank may have more flexibility to ease monetary conditions than markets currently assume.
For Bitcoin, lower interest rates generally create a favorable environment by reducing the opportunity cost of holding non-yielding assets and potentially weakening the dollar. Historical analysis demonstrates that Bitcoin has typically performed well during periods of monetary easing, with the 2020-2021 bull market coinciding with near-zero interest rates and aggressive quantitative easing. If UBS's forecast proves accurate, the second half of 2026 could see renewed tailwinds for Bitcoin as real yields decline and capital seeks alternative stores of value.
Hyperinflation Warning and Dollar Concerns
Perhaps the most significant macroeconomic development for Bitcoin in April 2026 was former Federal Reserve Chair Janet Yellen's warning that current U.S. fiscal and monetary policies could push the dollar toward hyperinflation. Speaking at a private event that subsequently leaked to financial media, Yellen reportedly expressed concern that the combination of persistent deficit spending, mounting national debt, and potential regime change at the Federal Reserve could undermine confidence in the world's primary reserve currency.
While Yellen's comments represent a worst-case scenario rather than a baseline forecast, they have fueled renewed interest in Bitcoin as a potential hedge against currency debasement. Bitcoin's fixed supply cap of 21 million coins and programmatic monetary policy stand in stark contrast to the discretionary nature of fiat currency management, appealing to investors concerned about long-term purchasing power preservation. If even a fraction of global institutional capital seeks Bitcoin exposure as a dollar hedge, the resulting demand could drive prices substantially higher regardless of near-term technical conditions.
Bitcoin Halving Cycle and Supply Dynamics
Bitcoin's unique monetary policy, characterized by predetermined supply issuance that halves approximately every four years, creates cyclical patterns that have historically influenced price behavior. Understanding where Bitcoin currently sits within this cycle provides crucial context for 2026 price expectations.
Current Halving Cycle Status
As of April 2026, Bitcoin has surpassed the 50% mark in its current halving cycle, with the April 2024 halving that reduced block rewards from 6.25 BTC to 3.125 BTC now firmly in the past. The current issuance rate of 3.125 BTC per block translates to an annual inflation rate below 1%, making Bitcoin one of the scarcest major assets globally. With approximately 19.68 million BTC already mined out of the 21 million cap, only 1.32 million coins remain to be issued over the coming decades.
The halving cycle theory suggests that Bitcoin's price action follows a predictable pattern tied to these supply shocks. Historically, the year following a halving has produced significant bull markets as reduced new supply meets sustained or growing demand. The 12-18 months after the April 2024 halving indeed witnessed substantial price appreciation, with Bitcoin reaching an all-time high of approximately $126,000 in October 2025. However, 2026 has brought a more complex dynamic as the initial halving euphoria fades and market participants debate whether the cycle peak has already occurred.
The "Lame Year" Theory
Fidelity's Director of Global Macro, Jurrien Timmer, has popularized the concept of a "lame year" following the initial halving surge, suggesting that Bitcoin often experiences a consolidation or correction phase approximately one year after the supply reduction event. If the October 2025 peak of $126,000 represents the cycle top for this halving period, 2026 could see a prolonged drawdown of 30-50% before the next significant bull market begins.
This theory carries important implications for current positioning. If valid, Bitcoin could test levels as low as $60,000-$70,000 later in 2026, providing patient investors with more attractive entry points than current prices offer. However, the unprecedented institutional adoption through ETFs may be altering traditional cycle dynamics, as continuous inflows create persistent demand that could prevent the deep corrections seen in previous cycles. The tension between historical patterns and evolving market structure represents one of the key uncertainties facing Bitcoin investors in 2026.
Supply Shock Potential
Despite debates about cycle timing, the fundamental supply dynamics remain overwhelmingly favorable for Bitcoin. The combination of lost coins, long-term holder accumulation, and institutional ETF purchases has created conditions for potential supply shocks that could drive rapid price appreciation. When demand spikes occur, there may be insufficient liquid supply to satisfy buyer interest, forcing prices higher to clear the market.
Data from on-chain analytics firms indicates that coins held for more than one year continue to reach new all-time highs, suggesting that long-term holders have little intention of selling at current prices. This "hodler" behavior reduces the effective float of tradeable Bitcoin, amplifying the impact of new demand entering the market. If institutional adoption continues at its current pace, the supply-demand imbalance could trigger substantial price appreciation even without the speculative fervor that characterized previous bull markets.

Geopolitical Tensions and Market Volatility
Bitcoin's price action in April 2026 has demonstrated sensitivity to geopolitical developments, particularly events that impact traditional financial markets and investor risk appetite. Understanding these relationships helps contextualize short-term volatility and identify potential catalysts for future price movements.
Iran-U.S. Conflict Impact
The escalating tensions between Iran and the United States have created significant volatility across all risk assets, including Bitcoin. In mid-April 2026, reports of failed peace talks and subsequent U.S. Navy blockade of the Strait of Hormuz triggered sharp market reactions. Bitcoin prices dropped from approximately $74,000 to below $71,000 within hours as investors sought safety in traditional haven assets.
The Strait of Hormuz, through which approximately 20% of global oil shipments pass, represents a critical chokepoint for global energy markets. Any disruption to shipping through this corridor typically triggers spikes in oil prices and risk-off positioning across financial markets. Bitcoin's initial reaction to these developments was correlated with broader risk asset declines, though the cryptocurrency demonstrated resilience by recovering losses more quickly than equities in subsequent sessions.
Safe Haven Narrative Evolution
Bitcoin's behavior during geopolitical stress tests continues to inform the debate about its classification as a safe haven asset or risk asset. The April 2026 experience suggests a more nuanced reality: Bitcoin may function as a risk asset during the initial shock phase of geopolitical events, when investors indiscriminately sell volatile holdings to raise cash, but potentially as a safe haven during prolonged periods of currency debasement or sovereign stress.
The recovery of Bitcoin prices following the initial Iran-U.S. tension selloff supports this interpretation. As investors processed the implications of potential oil supply disruptions and dollar weakness, Bitcoin attracted buying interest as a hedge against the inflationary pressures that often accompany geopolitical conflicts. This dual personality—risk asset in the short term, safe haven in the long term—requires investors to calibrate their expectations based on time horizon and the specific nature of unfolding events.
Regulatory Developments
The regulatory environment for Bitcoin and cryptocurrencies continues to evolve, with developments in 2026 providing both opportunities and challenges for market participants. The Federal Reserve's approval of Kraken as the first cryptocurrency bank with direct payment access represents a milestone in regulatory acceptance, potentially paving the way for further integration of digital assets into the traditional financial system.
Analysts suggest that Kraken's Fed approval could push Bitcoin toward $100,000 by reducing friction for institutional participation and validating cryptocurrency as a legitimate component of the financial infrastructure. This regulatory milestone follows the broader trend of increasing institutional acceptance that has characterized 2026, with major financial institutions offering Bitcoin custody, trading, and investment products to clients.
Price Predictions and Analyst Outlook
Bitcoin price predictions for 2026 span a wide range, reflecting the inherent uncertainty in forecasting an emerging asset class subject to rapid technological, regulatory, and macroeconomic changes. Aggregating analyst forecasts provides a framework for understanding potential scenarios while acknowledging the limitations of any specific prediction.
Conservative Forecasts: $60,000 - $80,000
Several prominent analysts maintain relatively conservative price targets for Bitcoin in 2026, citing the "lame year" cycle theory and the possibility that the October 2025 peak represented a cycle top. These forecasts suggest Bitcoin could trade in a $60,000-$80,000 range for much of the year, with the lower bound representing a 50% drawdown from all-time highs that would be consistent with historical post-halving corrections.
Proponents of conservative targets point to stretched institutional positioning, the potential for further Fed hawkishness if inflation proves persistent, and technical deterioration that could see Bitcoin test the 200-week moving average near $50,000 in an adverse scenario. While these outcomes are viewed as tail risks rather than base cases, they inform risk management considerations for investors with shorter time horizons.
Base Case Forecasts: $80,000 - $120,000
The consensus view among professional analysts places Bitcoin in an $80,000-$120,000 range for 2026, with the specific trajectory dependent on Federal Reserve policy decisions, institutional adoption trends, and broader market conditions. This range encompasses current price levels and allows for meaningful upside while acknowledging the maturation of the current bull market cycle.
Analysts at CoinCodex and CoinPedia have published detailed technical models suggesting that Bitcoin could retest its all-time high of $126,000 later in 2026 if key resistance levels are breached and macroeconomic conditions remain supportive. These forecasts typically assume continued institutional inflows, at least one Federal Reserve rate cut, and no major regulatory setbacks that would dampen institutional enthusiasm for cryptocurrency exposure.
Bullish Forecasts: $150,000 - $250,000
More optimistic analysts project Bitcoin reaching $150,000 or higher in 2026, driven by hyperinflation concerns, accelerating institutional adoption, and the supply shock dynamics discussed earlier. These forecasts often cite the precedent of previous halving cycles, where Bitcoin appreciated 10x or more from halving lows to cycle peaks. Applying similar multiples to the April 2024 halving price near $60,000 yields targets above $200,000.
Former Coinbase CTO Balaji Srinivasan and other Bitcoin advocates have suggested that 2026 could mark the beginning of a hyperbitcoinization scenario, where sovereign debt crises and currency failures drive mass adoption of Bitcoin as a global reserve asset. While viewed as unlikely by mainstream analysts, such tail risk scenarios inform the asymmetric payoff structure that attracts institutional capital seeking portfolio insurance against currency debasement.
Risks and Challenges
While the Bitcoin outlook for 2026 contains substantial opportunities, investors must remain cognizant of risks that could derail bullish scenarios or trigger significant price declines. Understanding these risks is essential for position sizing and risk management.
Regulatory Risk
The regulatory environment for Bitcoin remains fluid, with the potential for restrictive measures that could limit institutional participation or retail access. While the trend through early 2026 has been toward greater regulatory clarity and acceptance, political shifts or high-profile enforcement actions could reverse this progress. The ongoing criminal probe of Federal Reserve Chair Jerome Powell and potential regime change at the central bank create uncertainty about future regulatory attitudes toward cryptocurrency.
Macroeconomic Volatility
Bitcoin's correlation with traditional risk assets during periods of market stress remains a concern for investors seeking uncorrelated returns. If Federal Reserve policy becomes more hawkish than expected, or if global recessionary pressures intensify, Bitcoin could experience significant drawdowns alongside equities and other risk assets. The cryptocurrency has yet to be tested during a genuine global financial crisis, and its performance under such conditions remains uncertain.
Technical Breakdown
From a technical perspective, a sustained break below $70,000 would represent a significant bearish development that could trigger cascading liquidations and accelerate selling pressure. Such a breakdown would invalidate much of the constructive technical structure that has developed over the past several months and potentially signal the beginning of a deeper correction toward $50,000 or lower. Investors should monitor the $70,000 level closely as a key line in the sand for the current bull market thesis.
Competition and Technology Risk
Bitcoin faces ongoing competition from alternative cryptocurrencies, central bank digital currencies (CBDCs), and traditional financial infrastructure improvements that could reduce its competitive advantage. While Bitcoin's first-mover advantage and network effects remain formidable, technological innovation elsewhere in the cryptocurrency space could siphon attention and capital from the dominant digital asset.

Investment Strategies for April 2026
Given the complex interplay of technical, fundamental, and macroeconomic factors influencing Bitcoin in April 2026, investors should consider tailored strategies aligned with their risk tolerance, time horizon, and investment objectives.
Dollar-Cost Averaging (DCA)
For long-term investors convinced of Bitcoin's fundamental value proposition but uncertain about short-term price direction, dollar-cost averaging remains the most prudent approach. By investing fixed amounts at regular intervals, investors can smooth out volatility and avoid the psychological pitfalls of attempting to time market bottoms and tops. Given the institutional adoption trends and supply dynamics discussed earlier, accumulating Bitcoin through periodic purchases during 2026 is likely to reward patient capital over multi-year timeframes.
Tactical Trading Approaches
More active traders can exploit the well-defined technical levels that currently govern Bitcoin price action. Long positions initiated near the $71,000-$72,000 support zone with stops below $70,000 offer favorable risk-reward ratios, while breakout trades above $77,500 could capture momentum toward $85,000 or higher. Conversely, short-term shorts might be considered on failures at the $76,000 resistance level, though the overall trend structure suggests that counter-trend positions should be smaller and more tightly managed than trend-following trades.
Portfolio Allocation Framework
Modern portfolio theory suggests that a small allocation to Bitcoin can enhance risk-adjusted returns for traditional portfolios due to the asset's low correlation with stocks and bonds. Financial advisors increasingly recommend 1-5% allocations to Bitcoin for appropriate clients, with the specific percentage dependent on individual risk tolerance and investment timeline. Investors should view Bitcoin as a long-term holding rather than a trading vehicle, avoiding the temptation to react to short-term price swings that are inevitable in such a volatile asset class.
Conclusion
Bitcoin enters April 2026 at a fascinating crossroads, balancing the maturation of its market structure against the persistent volatility that defines cryptocurrency investing. Trading near $77,476, the digital asset has established a clear technical range that will likely resolve in a significant directional move as the year progresses. Whether that move takes Bitcoin to new all-time highs above $126,000 or triggers a deeper correction toward $60,000 will depend on the interaction of institutional adoption trends, Federal Reserve policy decisions, and broader macroeconomic conditions.
The institutionalization of Bitcoin through spot ETFs has fundamentally altered the market's supply-demand dynamics, creating persistent buying pressure that absorbs sell flows and provides a floor under prices. BlackRock's $284 million single-day inflow and Morgan Stanley's market entry demonstrate that institutional capital views Bitcoin as a permanent fixture in portfolio construction rather than a speculative fad. This structural demand provides fundamental support for prices even during periods of technical weakness or macroeconomic uncertainty.
For investors considering Bitcoin allocation in April 2026, the current environment offers a reasonable entry point within the established trading range, with clear risk management levels defined by the $70,000 support and $77,500 resistance. Dollar-cost averaging strategies allow participation in Bitcoin's long-term appreciation potential while mitigating the risk of poor timing. The combination of fixed supply, growing institutional adoption, and potential dollar weakness creates an asymmetric opportunity where downside is limited by structural demand while upside could be substantial if bullish scenarios materialize.
As always, investors should conduct their own research, understand the risks inherent in cryptocurrency investing, and allocate capital appropriately within a diversified portfolio. Bitcoin remains a volatile asset capable of significant drawdowns, but the maturation of its market structure and the validation of its value proposition through institutional adoption suggest that the long-term trajectory remains favorable for patient capital.
Ready to explore Bitcoin investment opportunities and build your cryptocurrency portfolio? Sign up for Intellectia.ai to access professional-grade research, portfolio tracking, and AI-powered analysis tools designed for the modern digital asset investor. Our platform provides real-time market insights, technical analysis, and institutional-grade research to help you navigate the evolving cryptocurrency landscape with confidence.