WS Overview
-
$
0.000
0.000(0.000%)
At close0.000(0.000%)Aft-market
ET
Loading chart...

The current price of WS is 40.73 USD — it has increased 3.9
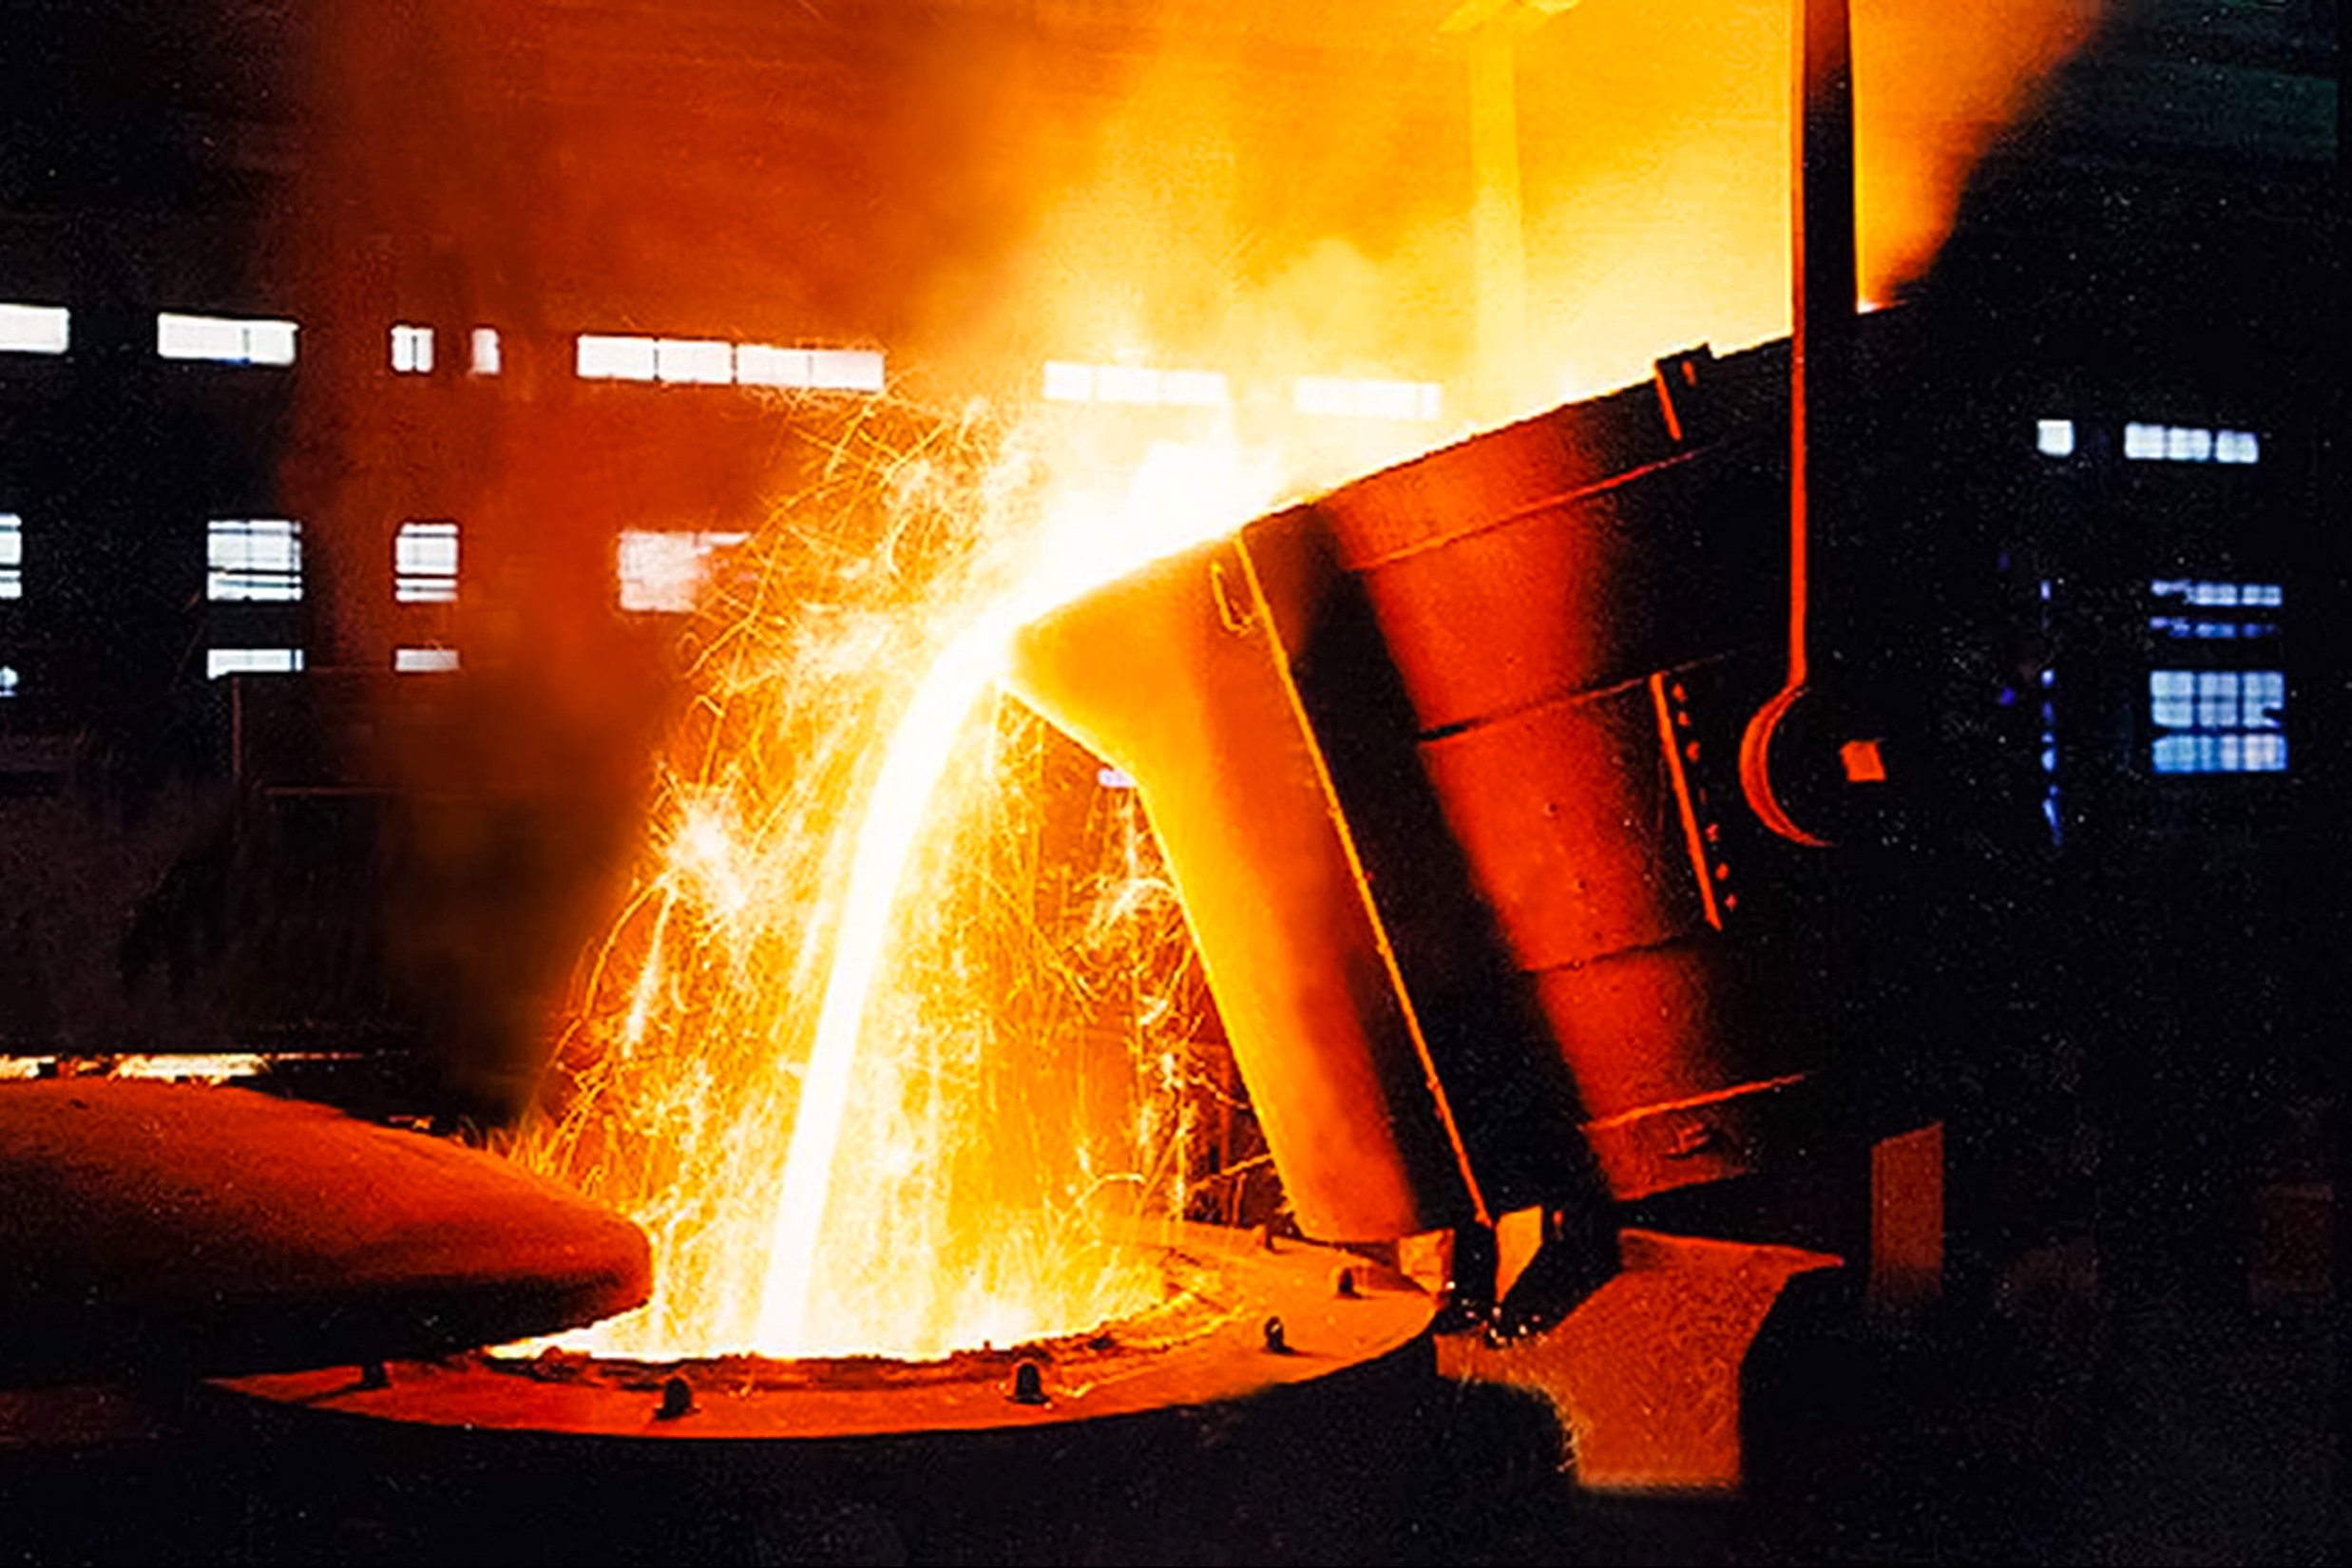
Worthington Steel, Inc. is a metals processor, which provides a range of products and services that span a variety of end markets. The Company delivers steel processing across end-markets including automotive, heavy truck, agriculture, construction, and energy. It serves its customers by processing flat-rolled steel coils, which source primarily from various North American steel mills, into the precise type, thickness, length, width, shape, and surface quality required by customer specifications. Its Flat Rolled Steel products offer Hot rolled steel, Cold rolled steel, and Galvanized steel. It provides solutions for industries such as alternative energy, appliance, trucking, rail car, shipbuilding, construction, trailer, elevator/escalator, and furniture. It also manufactures engineered electrical steel lamination solutions for electric motors, transformers and generators. Its products include Motor & Generator Laminations and Transformer Laminations.
Wall Street analysts forecast WS stock price to rise over the next 12 months. According to Wall Street analysts, the average 1-year price target for WS is39.00 USD with a low forecast of 39.00 USD and a high forecast of 39.00 USD. However, analyst price targets are subjective and often lag stock prices, so investors should focus on the objective reasons behind analyst rating changes, which better reflect the company's fundamentals.
Worthington Steel Inc revenue for the last quarter amounts to 769.80M USD, increased 11.99
Worthington Steel Inc. EPS for the last quarter amounts to 0.20 USD, decreased -25.93
Worthington Steel Inc (WS) has 4800 emplpoyees as of June 20 2026.
Today WS has the market capitalization of 2.07B USD.